Examples
examples.RmdPlot
Descriptive text.
litterboom_counts |>
  group_by(category, location) |>
  summarise(count = sum(count)) |>

  ggplot(aes(x = category,
             y = count,
             fill = category)) +
  geom_col() +
  facet_wrap(~location) +
  coord_flip() +
  theme_bw(base_size = 14) +
  theme(legend.position = "none",
panel.grid = element_blank()) 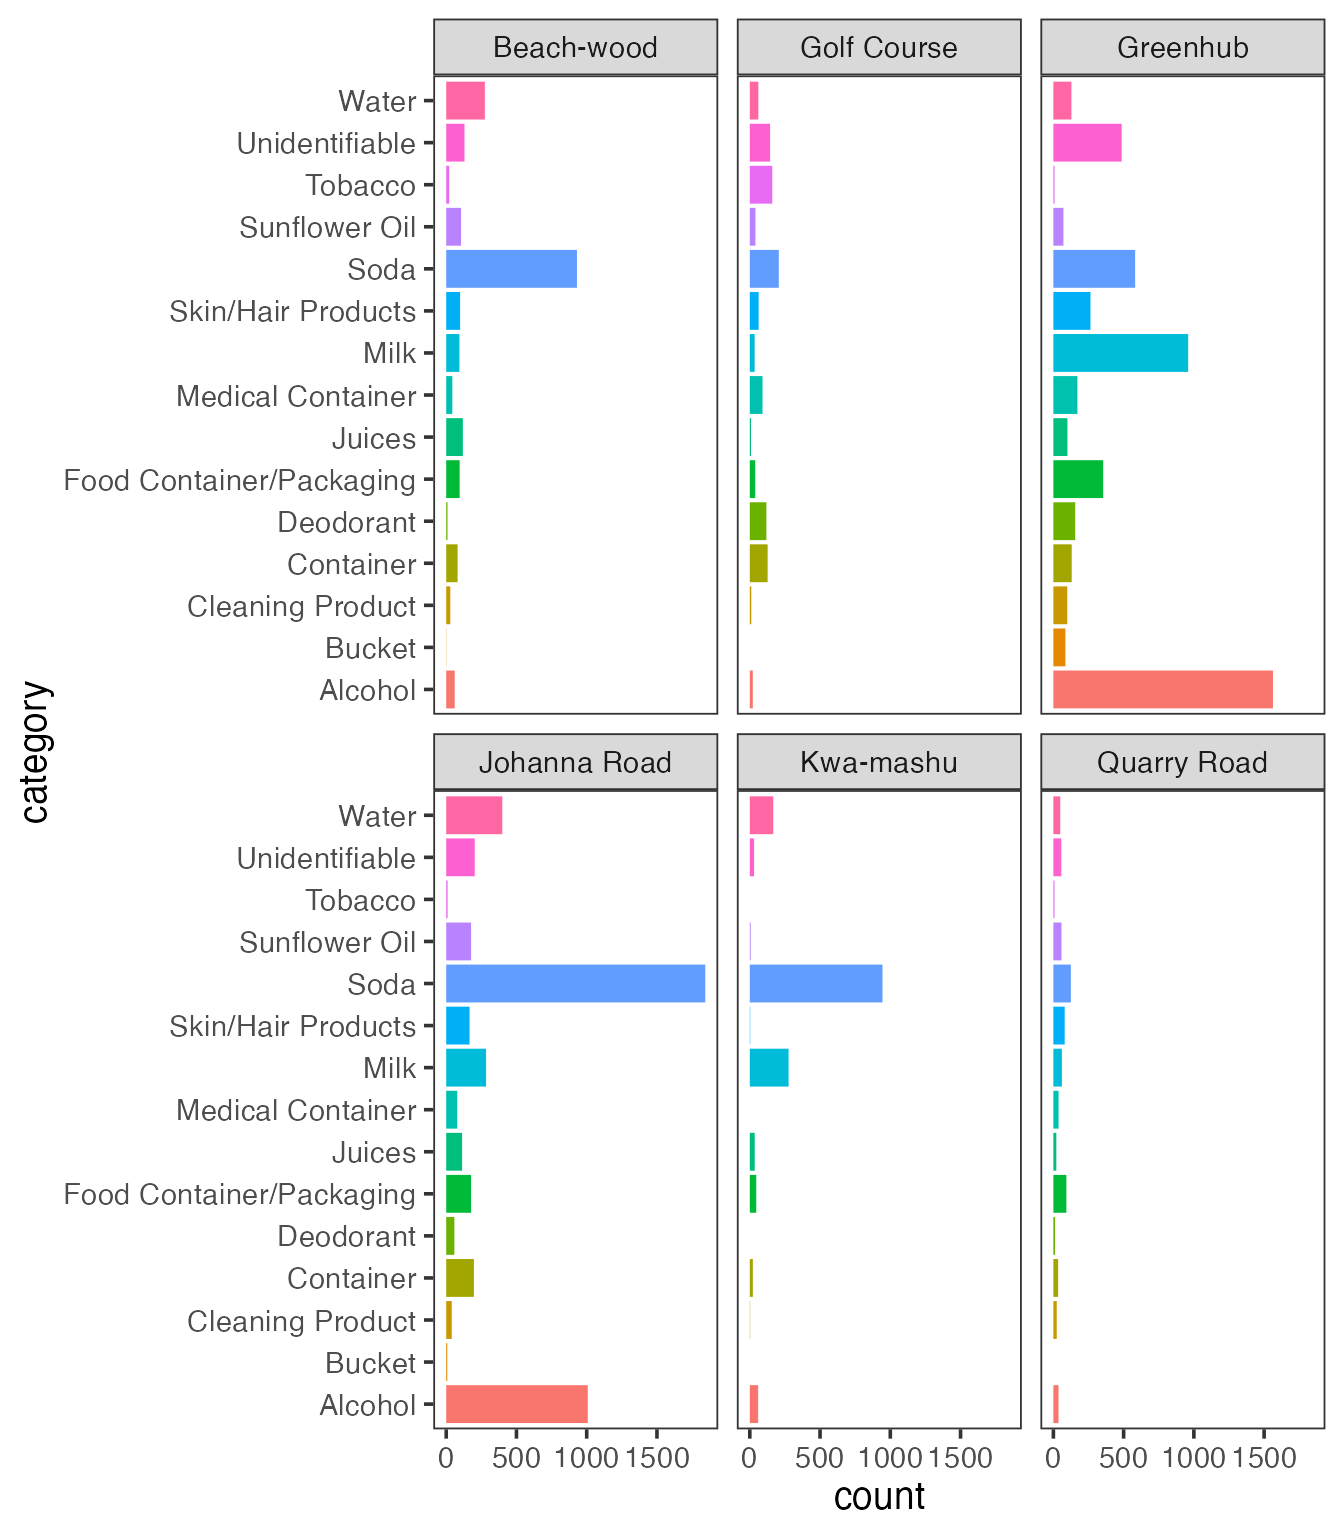
The following Graph is showing the distribution of the different plastic and waste types for the sampling time (September 19th 2022 - Oktober 17th 2022) in kg.
plot_stacked_beachwood <- plastic_types |>
  filter(place == "Beachwood Mangrove") |>
  rename(footwear = shoes) |>
  pivot_longer(cols = c(pet:pp, ps:footwear), names_to = "group", values_to = "value") |>
  replace_na(list(value = 0)) |>
  group_by(date, group) |>
  summarise(n = sum(value)) |>
  mutate(percentage = n / sum(n)) |>
  mutate(date = as_date(date)) |>
  ggplot(aes(x = date, y = percentage * 100, fill = group)) +
  geom_area(alpha = 0.6 ,linewidth = 0.6, colour = "white") +
  scale_y_continuous(expand = c(0, 0, 0.05, 0)) +
  scale_x_date(expand = c(0, 0, 0.05, 0)) +
  scale_fill_viridis_d(name = "Waste type",
                       labels = c("Footwear", "Glass", "Other Plastics", "Other Waste",
                                  "PE", "PET", "PP", "PS")) +
  labs(title = "Distribution of waste types (in kg)",
       subtitle = "Beachwood Mangrove, Durban, South Africa",
       x = "Date of sampling in 2022",
       y = "Weight (kg)") +
  theme_gray() +
  theme(panel.grid.minor = element_blank(),
        panel.grid.major.x = element_blank(),
        axis.line = element_line(),
        panel.background = element_rect(fill = "white"),
        panel.grid.major = element_line("grey95", linewidth = 0.25),
        legend.key  = element_rect(fill = NA))

plot_stacked_beachwood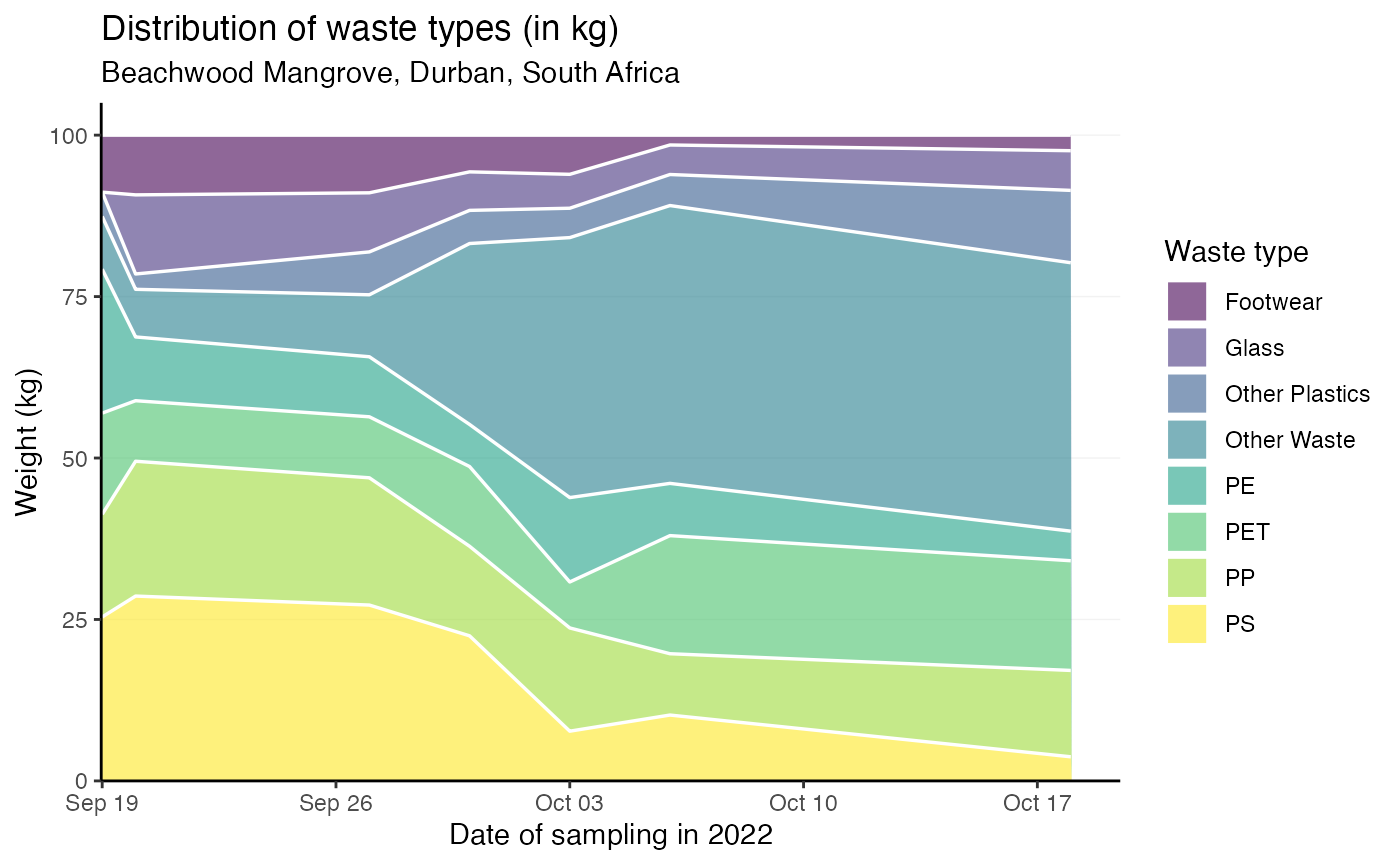
Prepare a map
leaflet(locations)  |>
  setView(lng = locations$longitude[[4]],
          lat = locations$latitude[[4]],
          zoom = 13) |>
  addTiles() |>
  addCircleMarkers(
    lng = ~longitude,
    lat = ~latitude,
    label = ~location,
    radius = 10,
    stroke = FALSE,
    fillOpacity = 1,
    labelOptions = labelOptions(noHide = T,
                                textsize = "10px",
                                direction = "left",
                                offset = c(0, 0),
                                style = list(
                                  "box-shadow" = "3px 3px rgba(0,0,0,0.25)",
                                  "border-color" = "rgba(0,0,0,0.5)",
                                  "font-style" = "italic"
                                )))