Notebook
article.RmdThe purpose of this notebook is to perform some initial exploratory data analysis for air quality data from Malawi. Based on this analysis, in-depth analysis will be performed and publication ready figures can be produced.
The reproducible manuscript can be found in a separate repository: https://github.com/Global-Health-Engineering/manuscript-qechairquality
Data
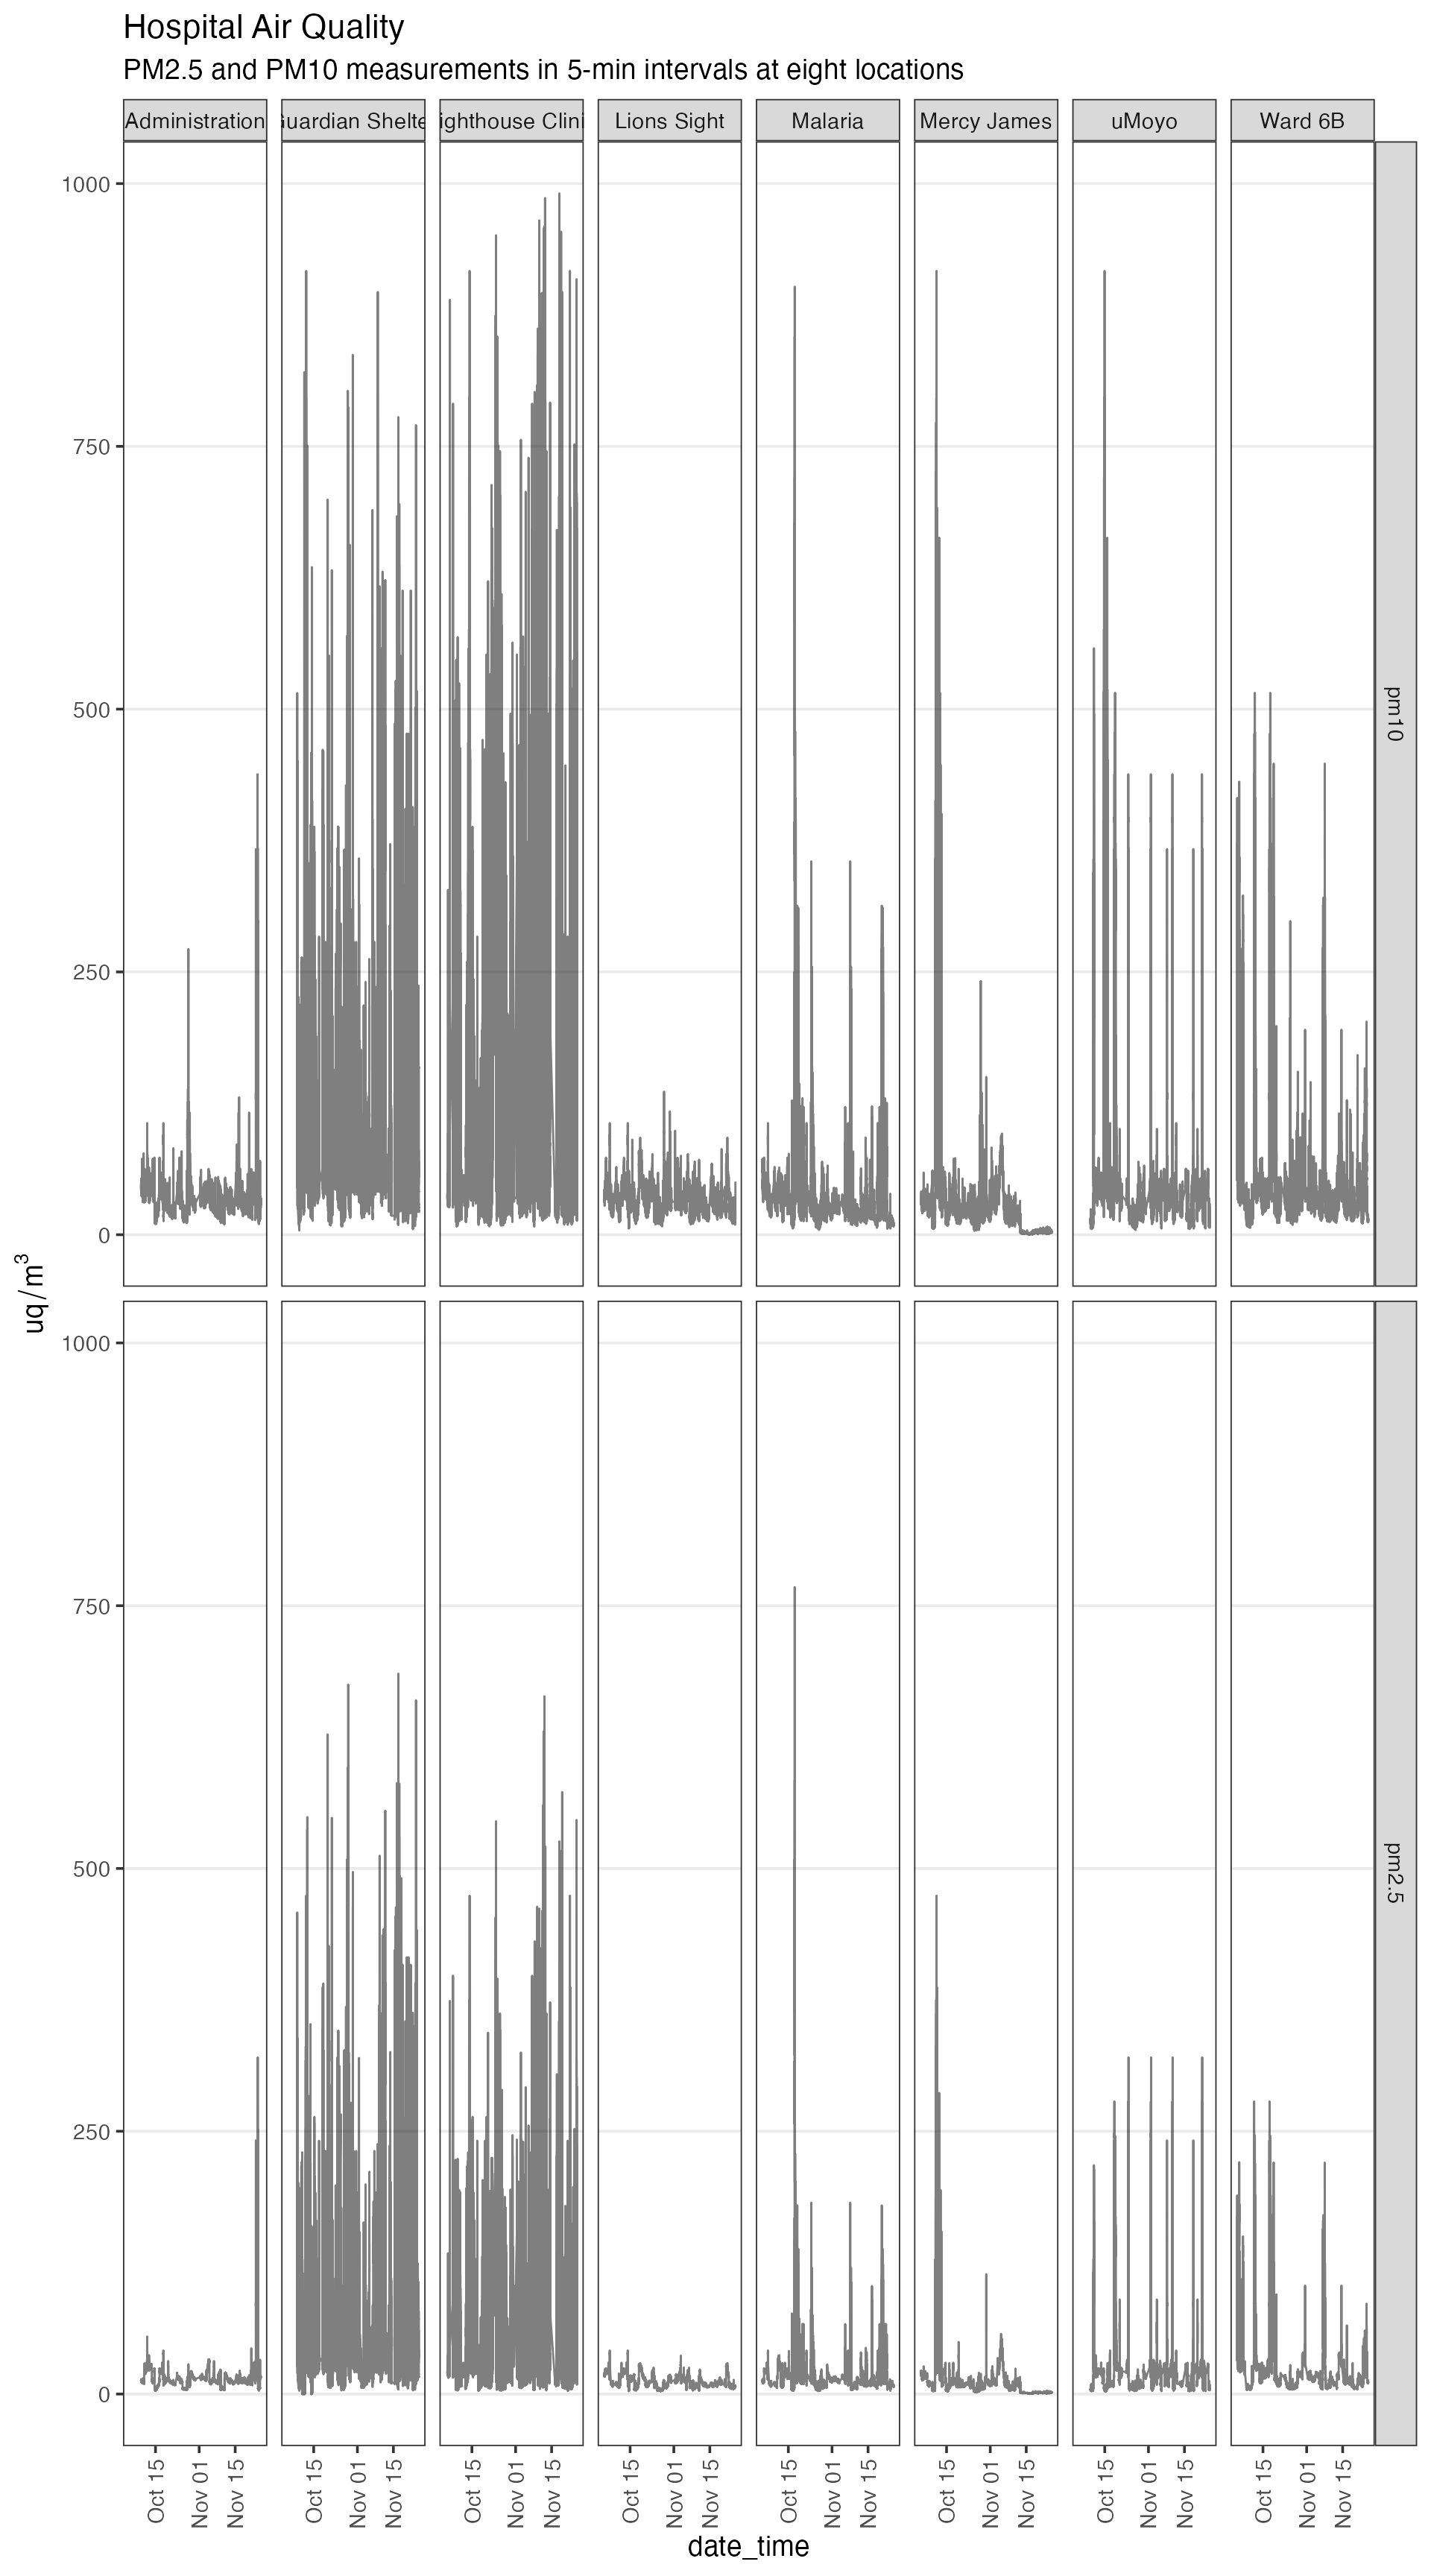
Air quality data (PM2.5 and PM10) was collected in roughly 5-minute intervals from eight locations at one hospital over the period of 3 months. The locations are Administration, Guardian Shelter, Lighthouse Clinic, Lions Sight, Malaria, Mercy James, Ward 6B, and uMoyo.
One sensor was installed at each location, either on the side or on the outside wall.
Data Exploration
TODO List:
- 24 hour average (DONE)
- baseline (not the two peaks) (not doing)
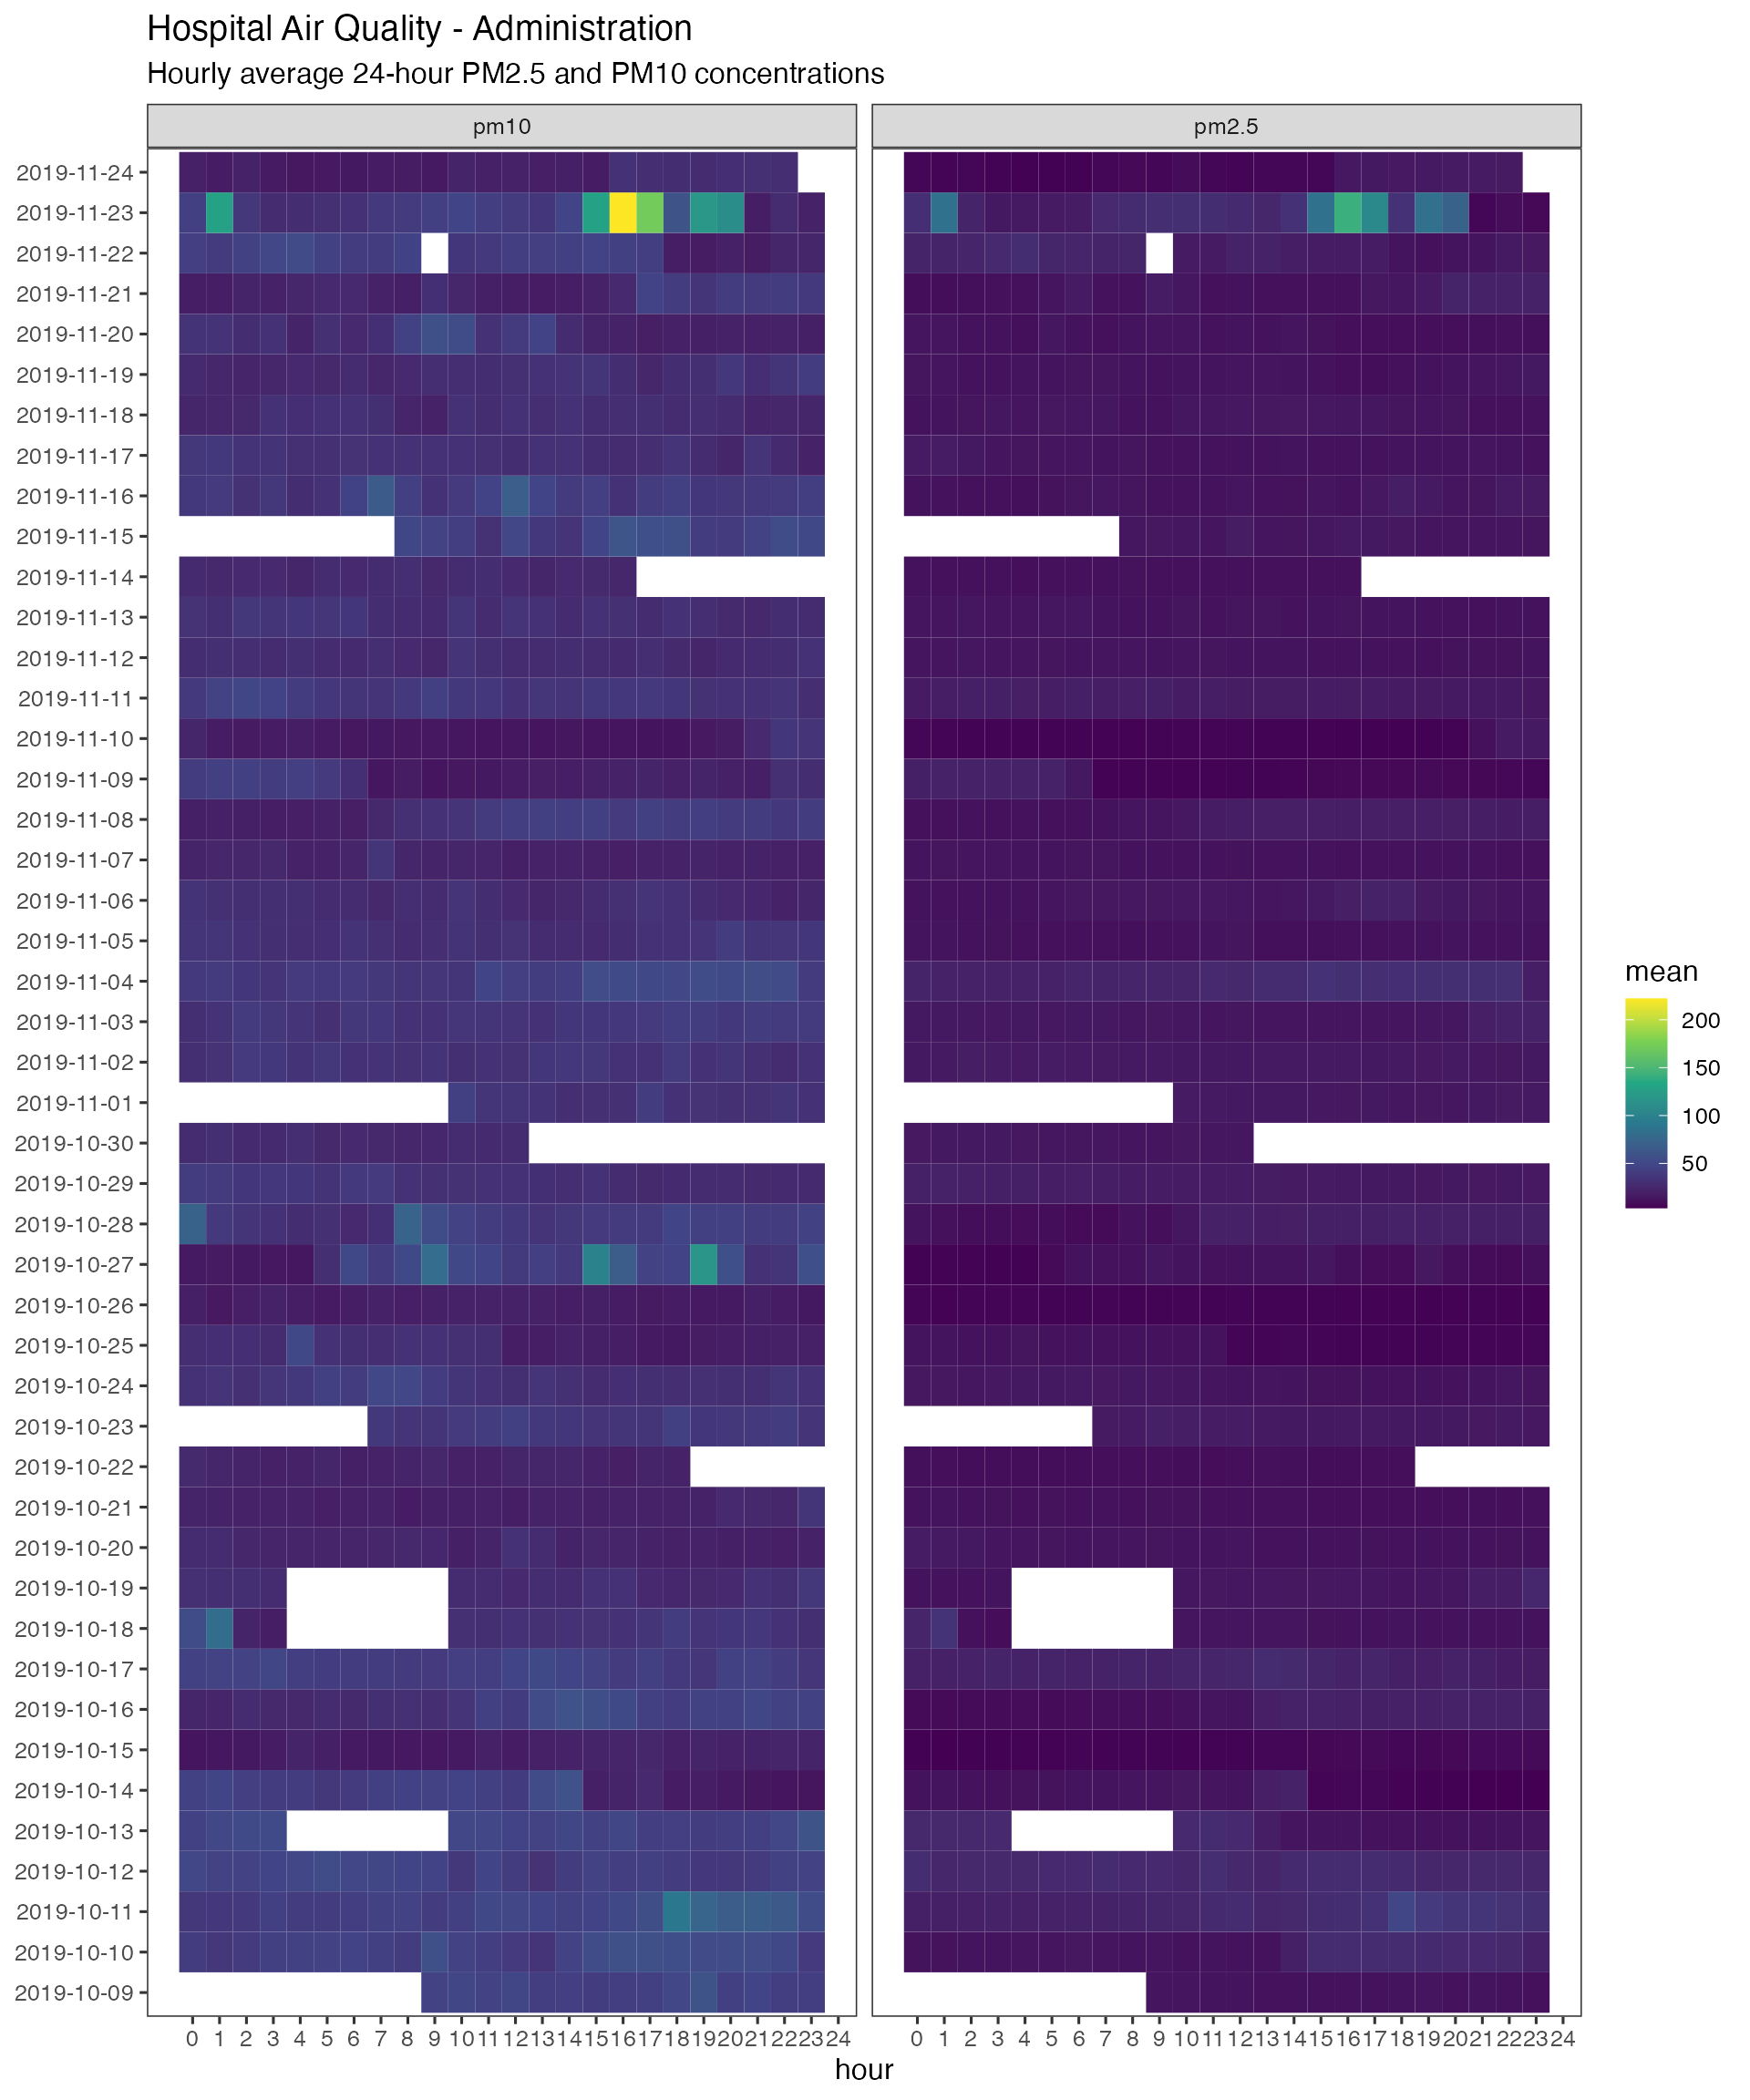
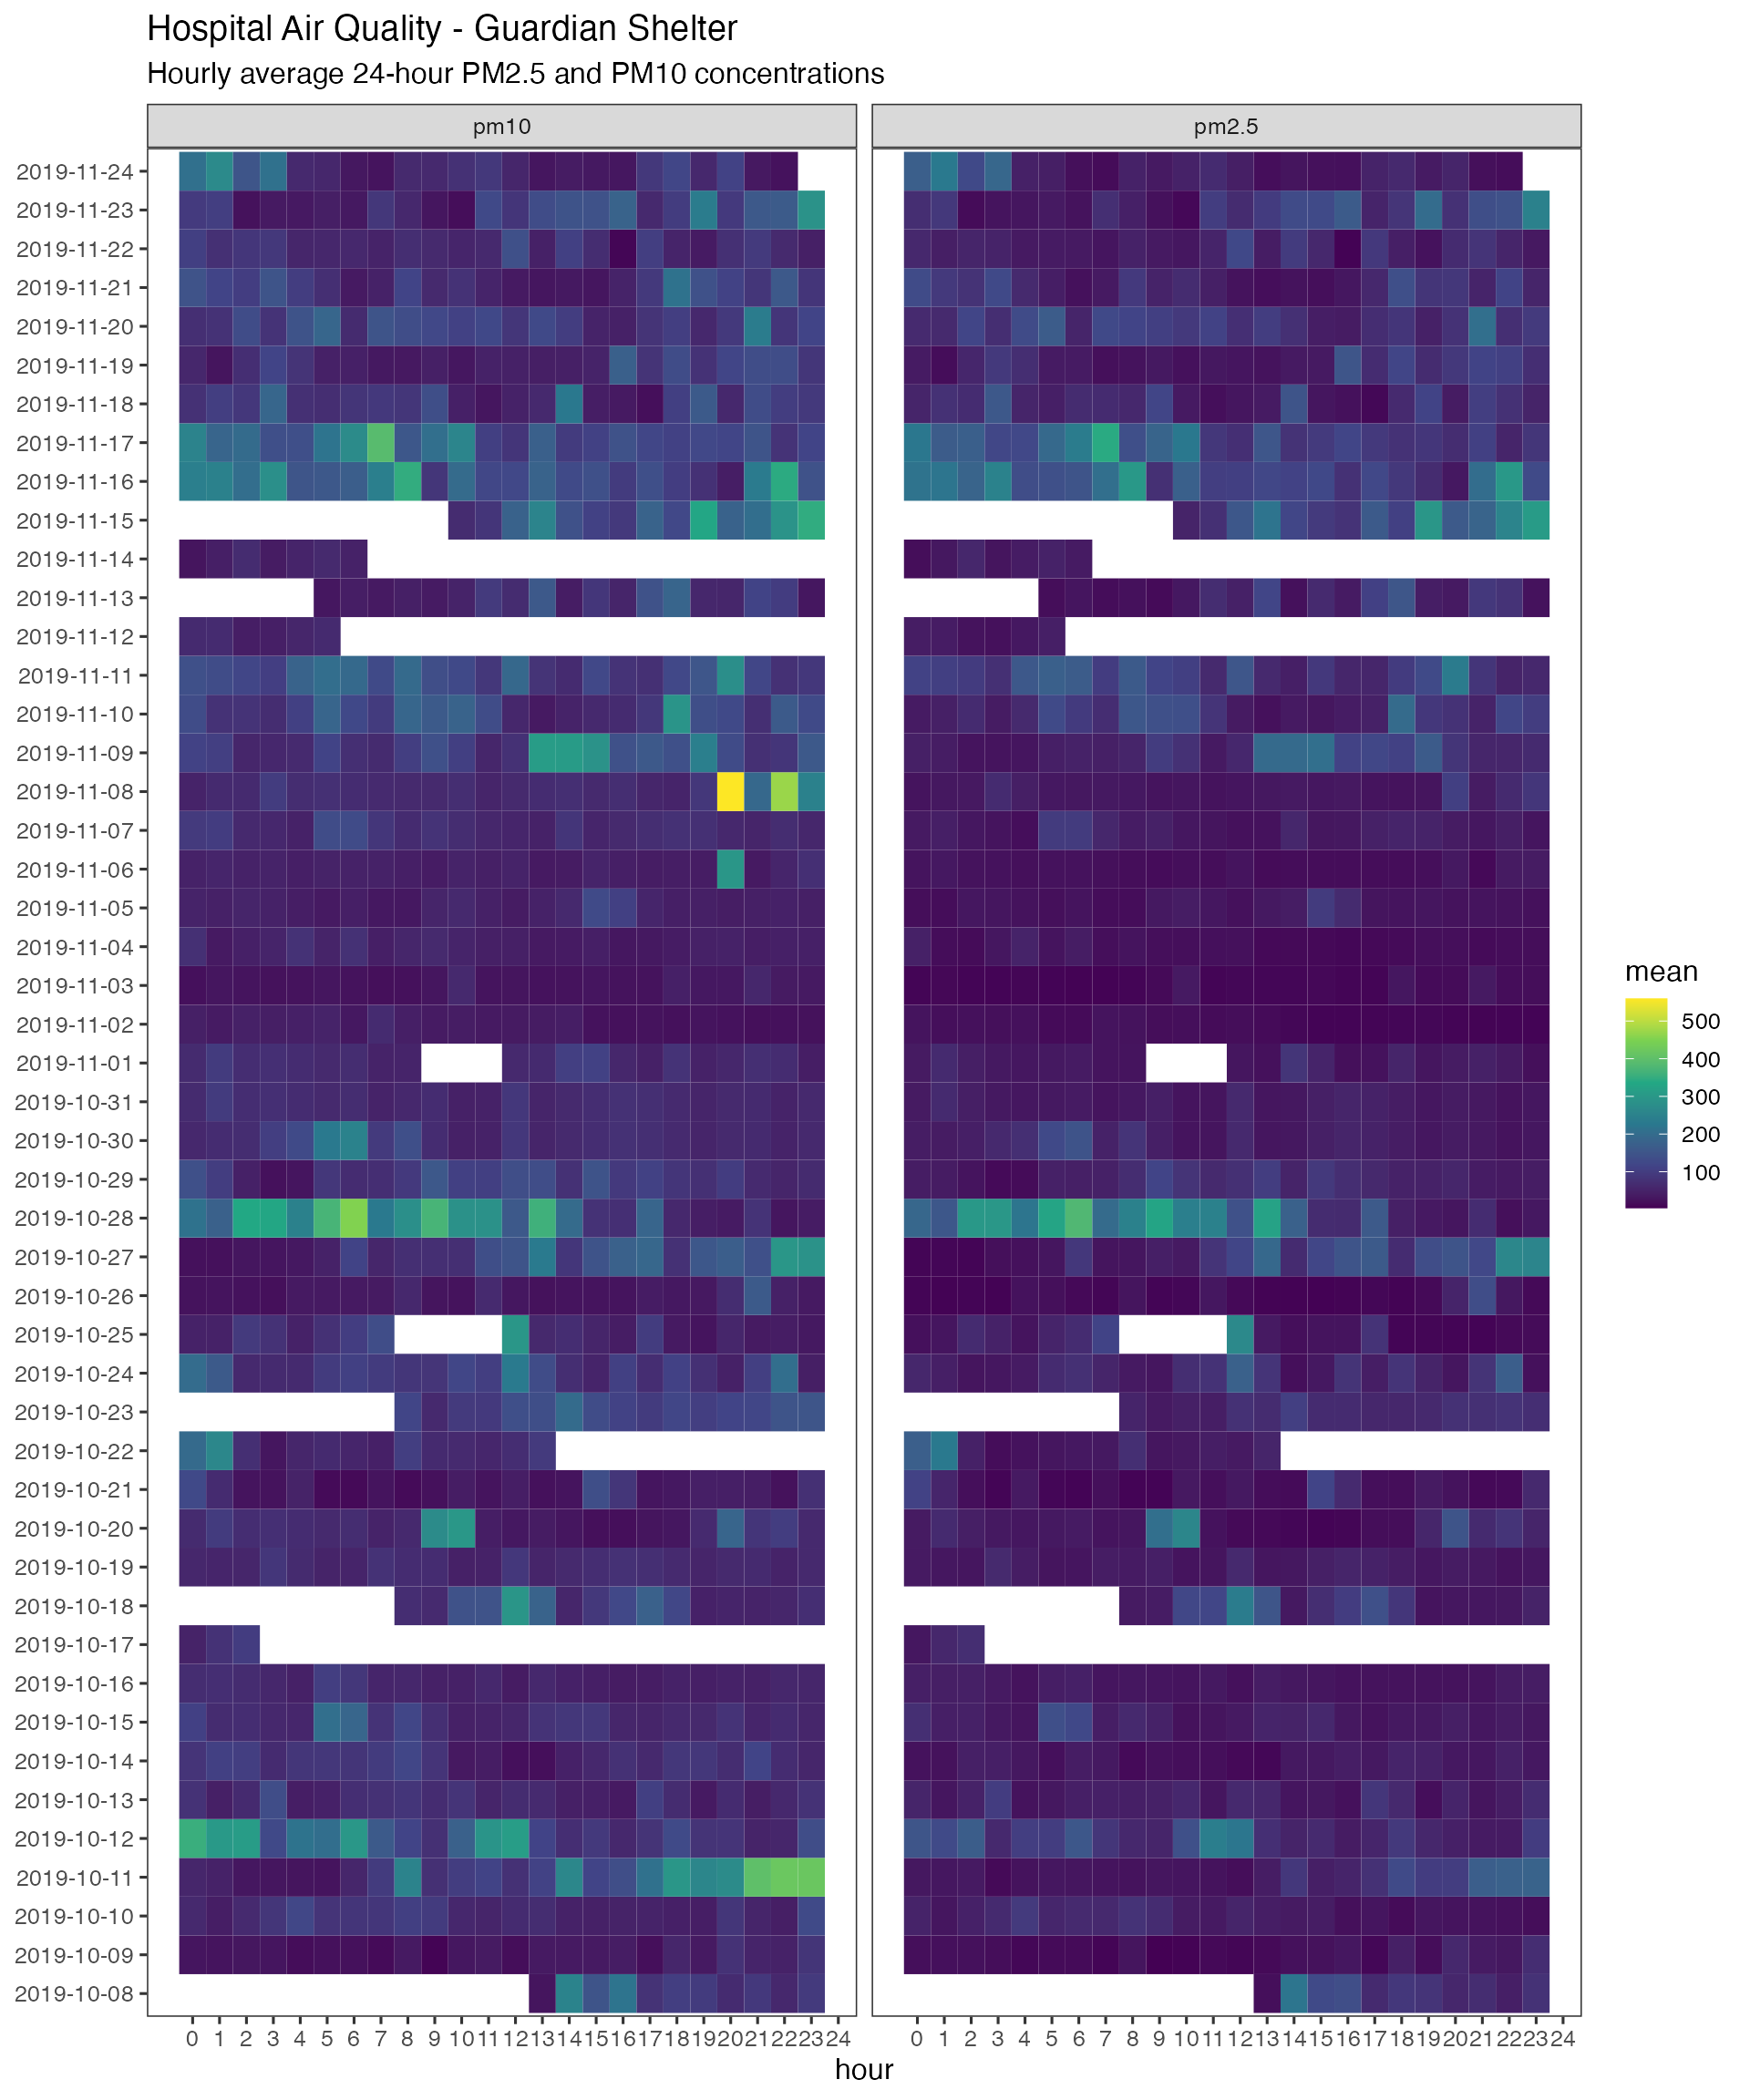
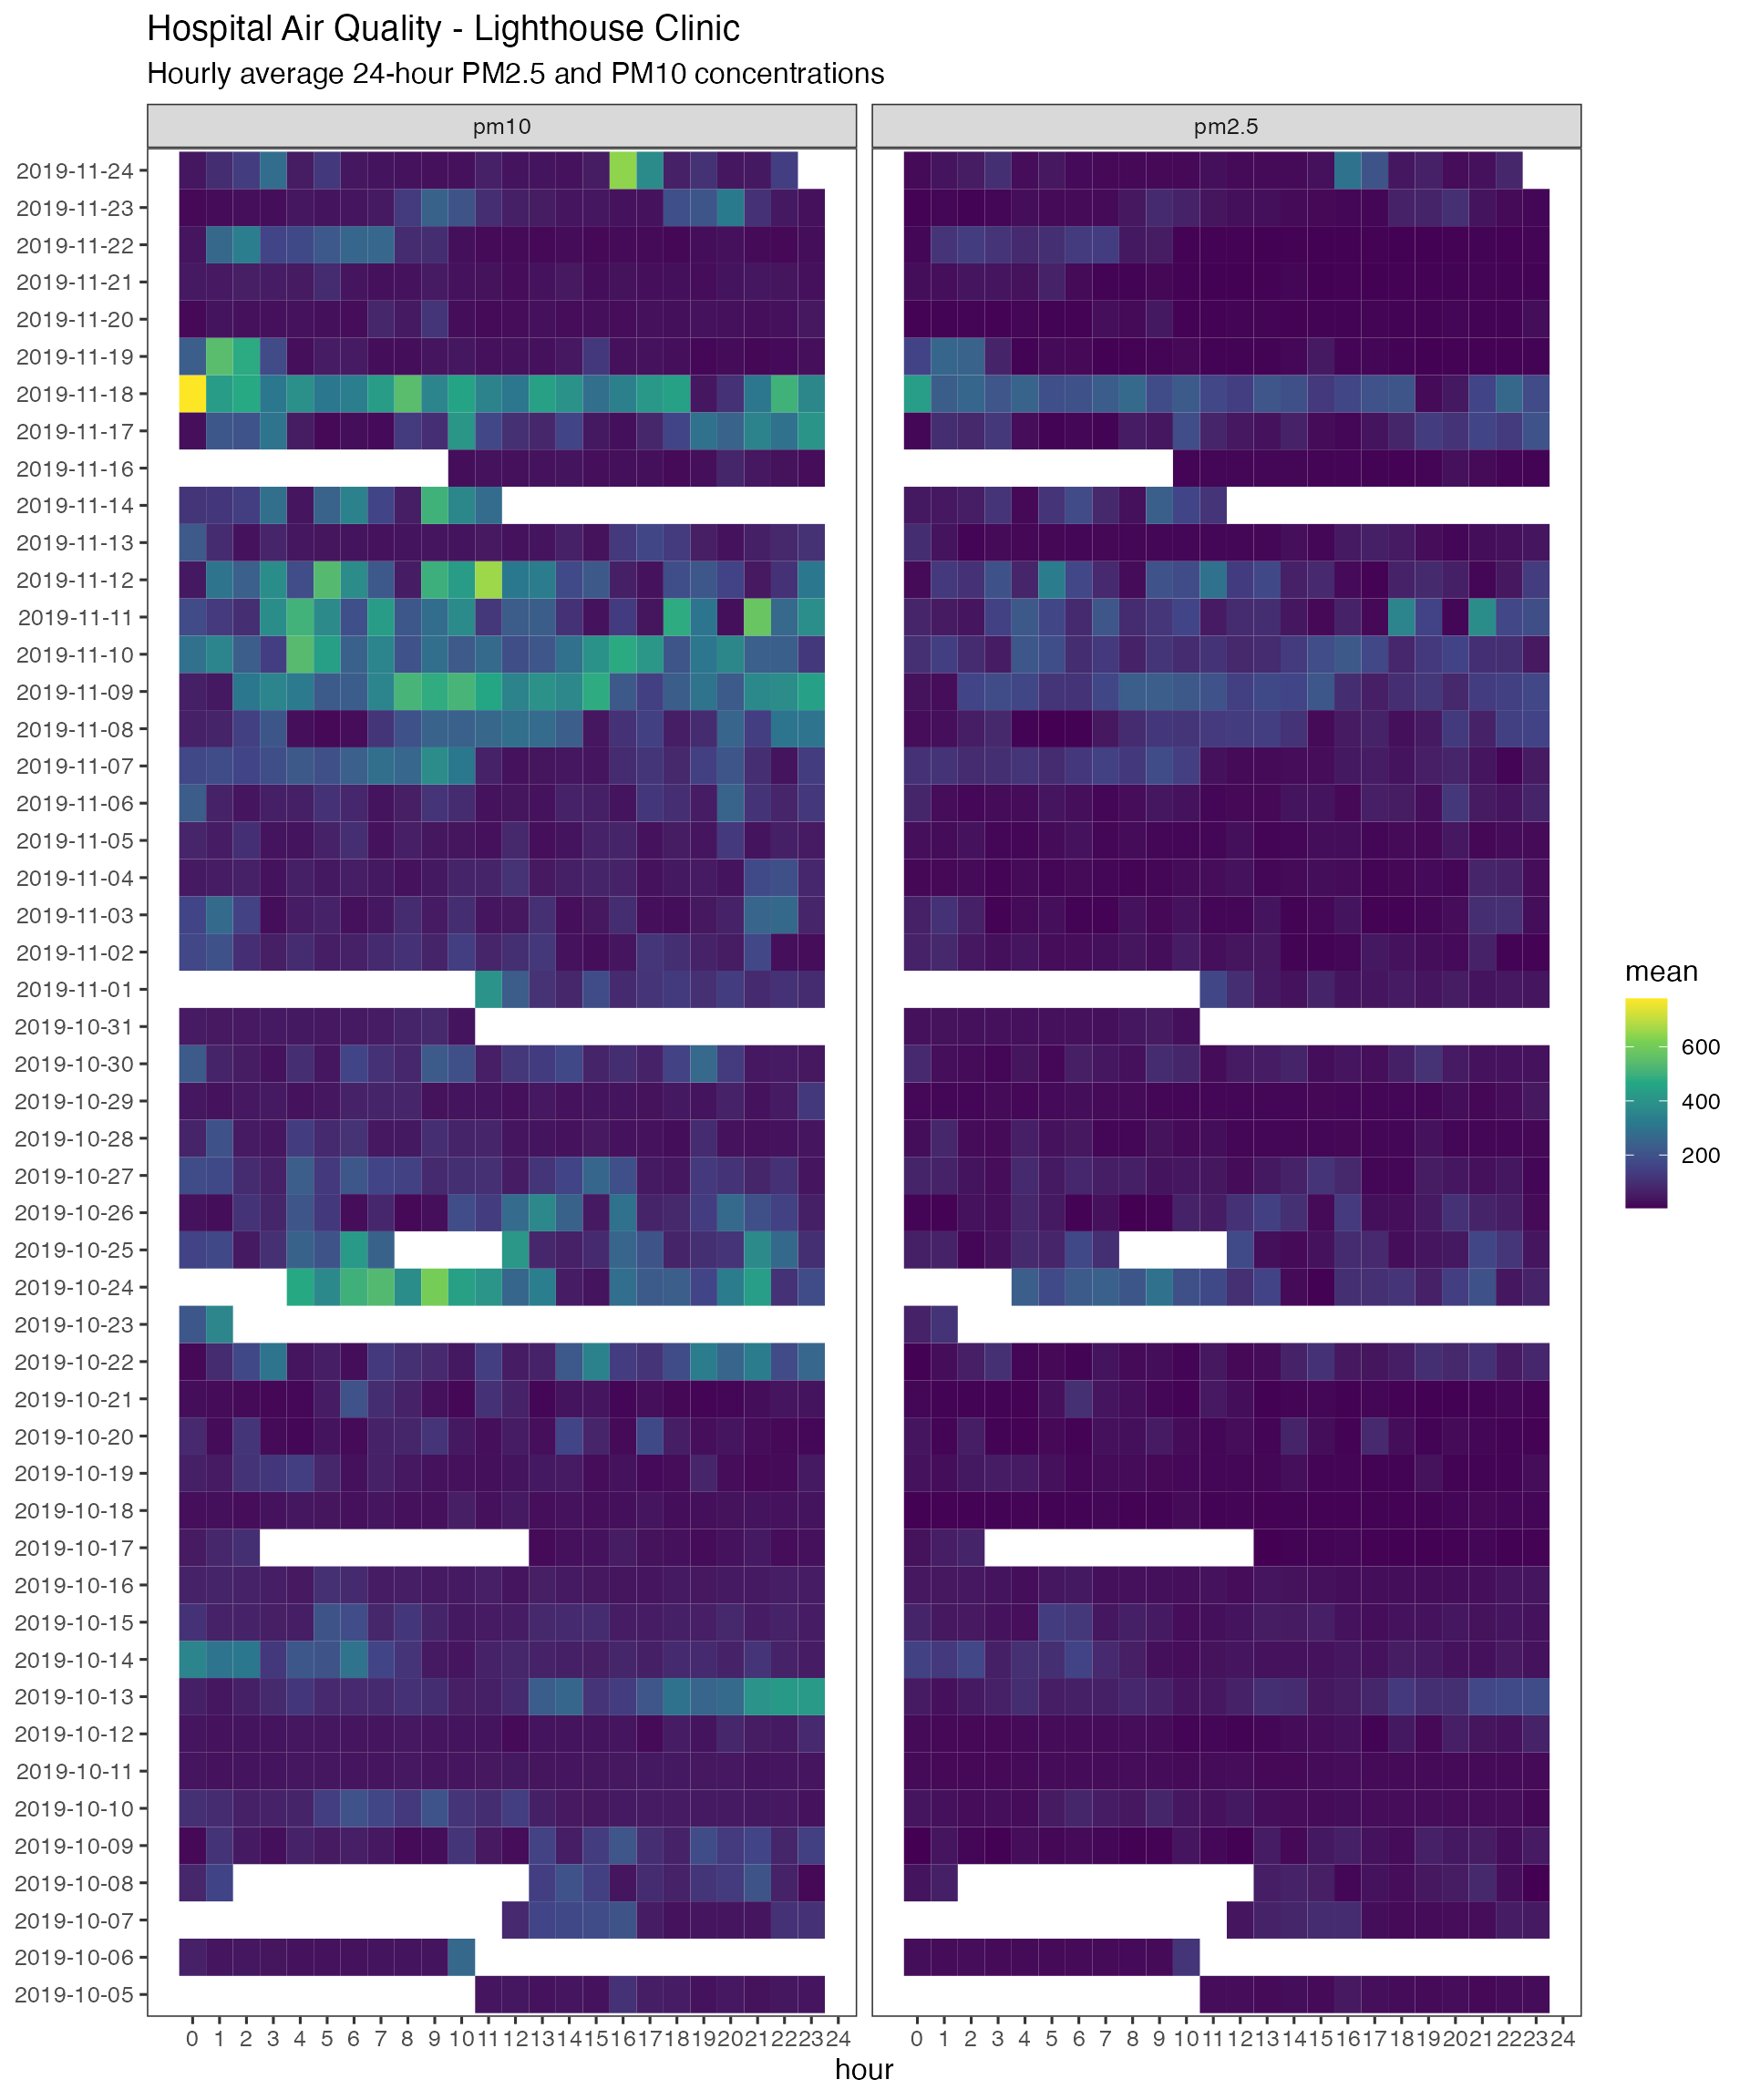
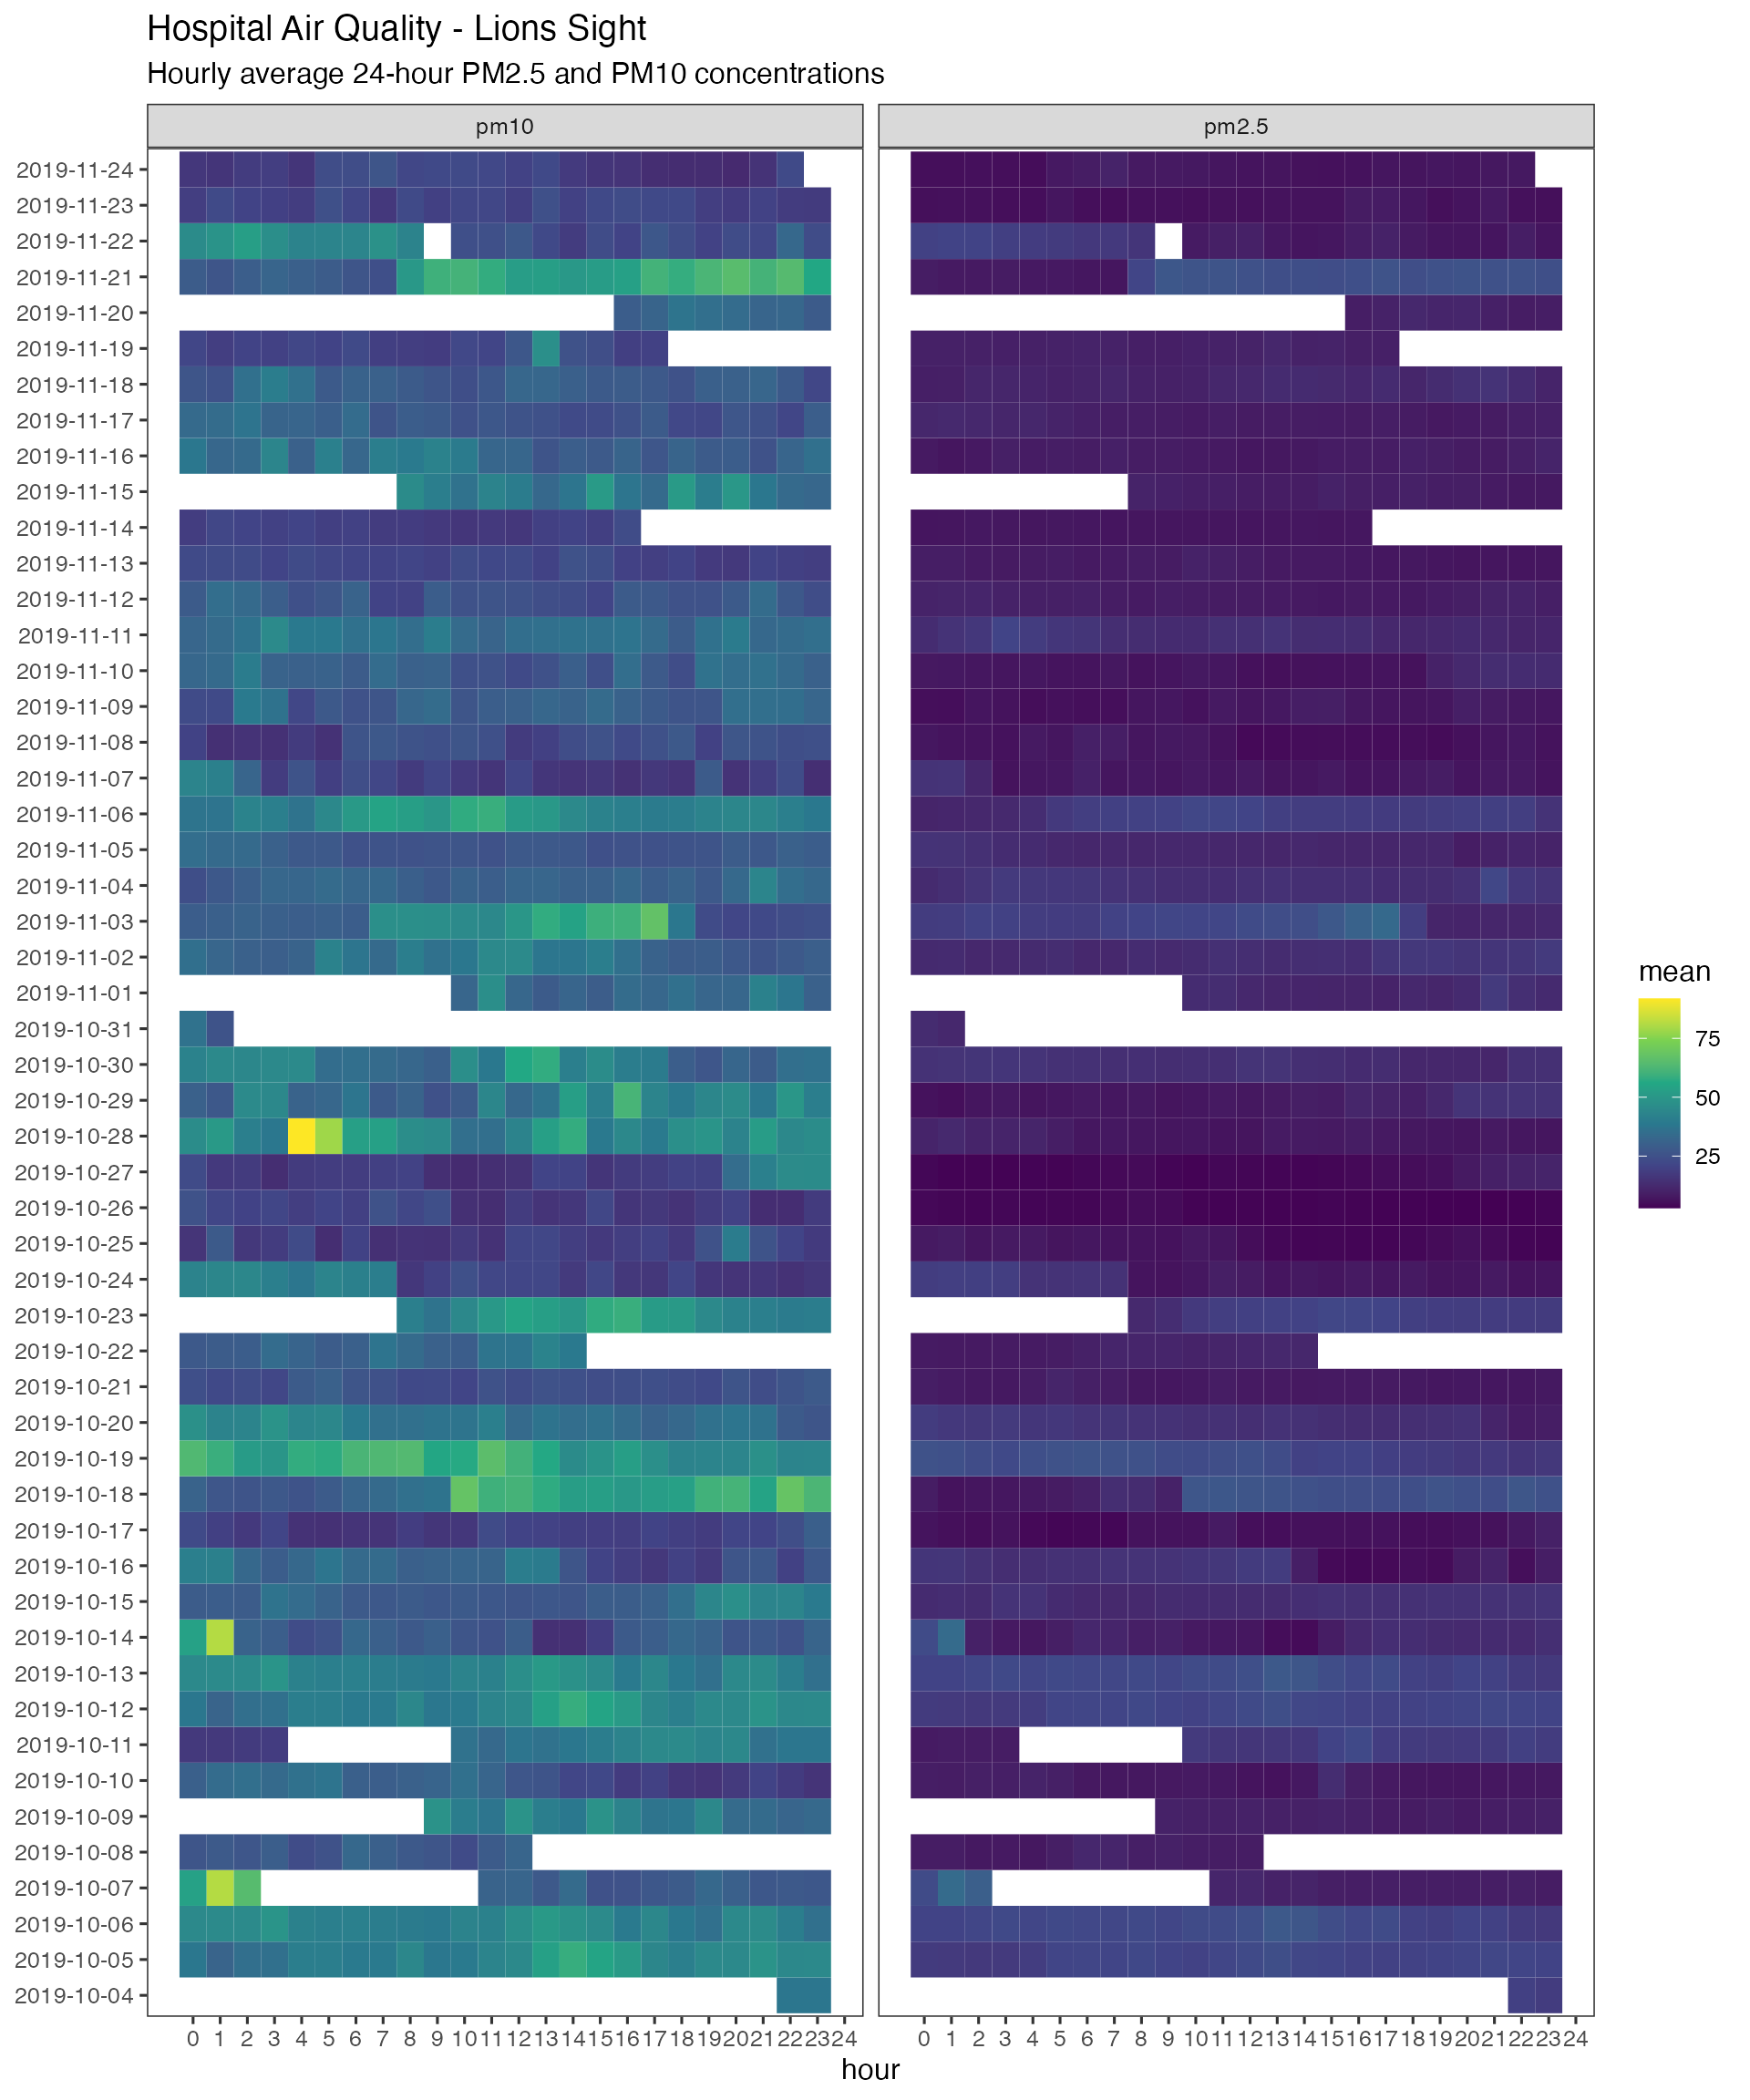
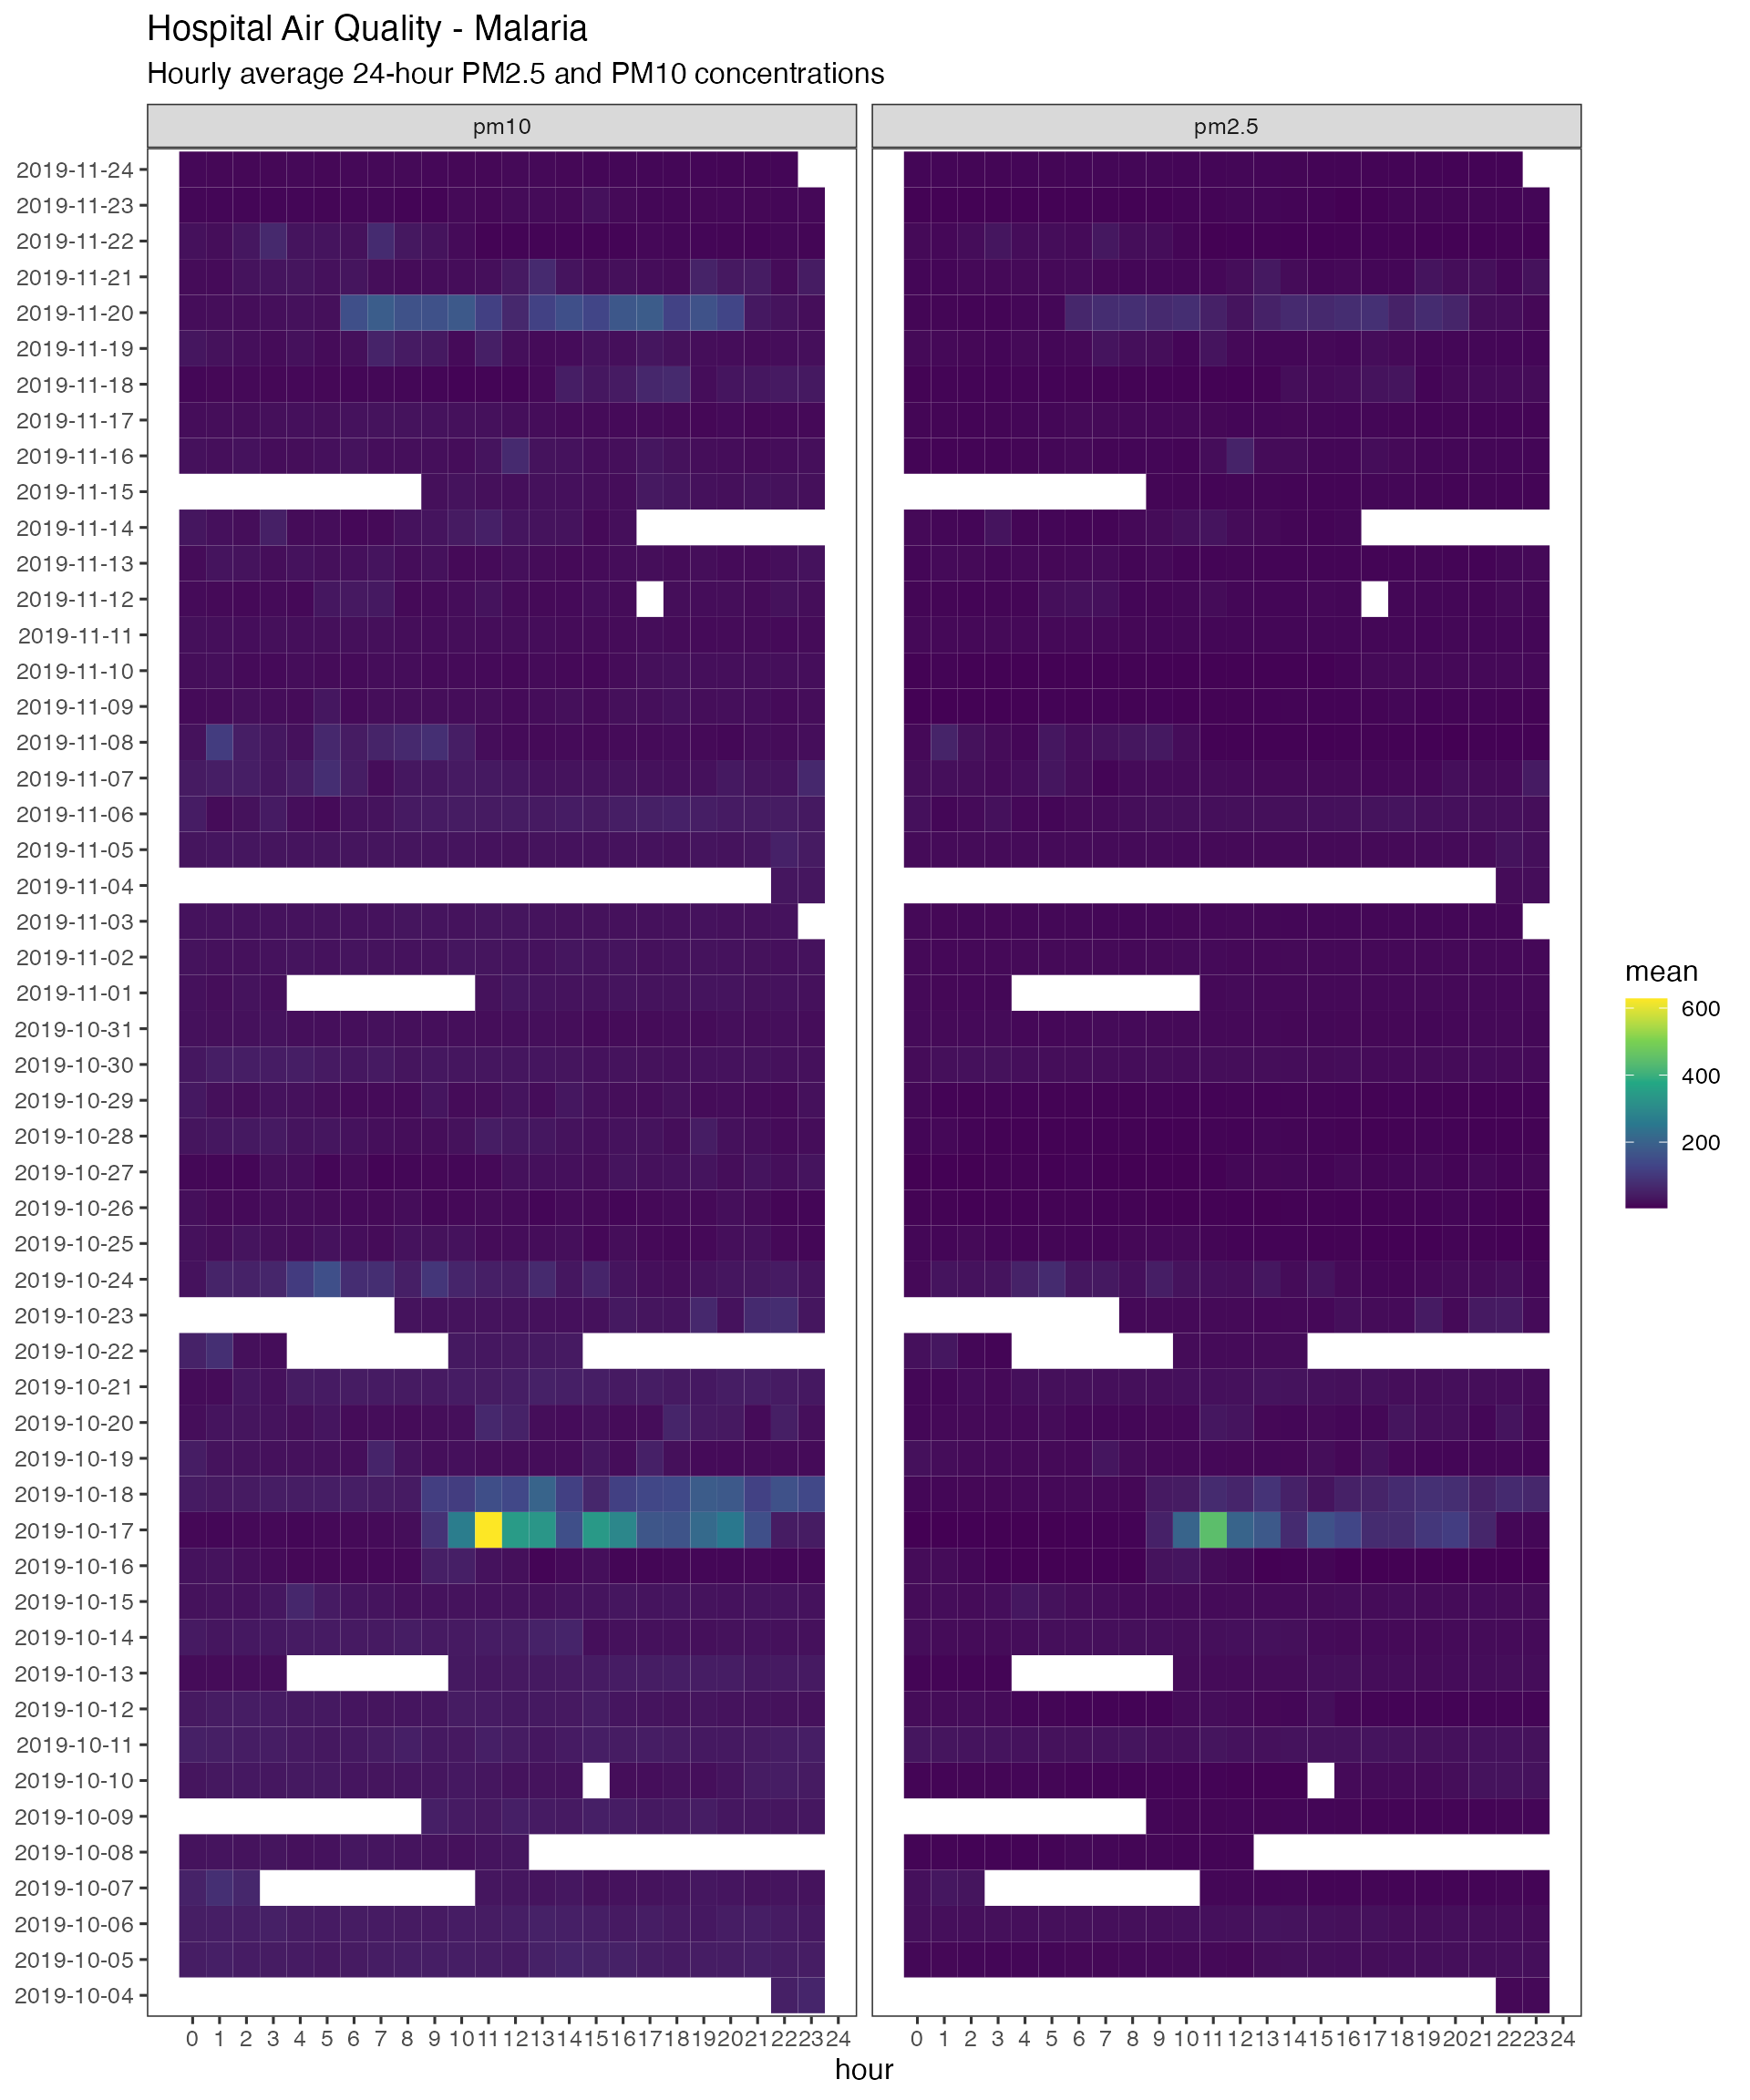
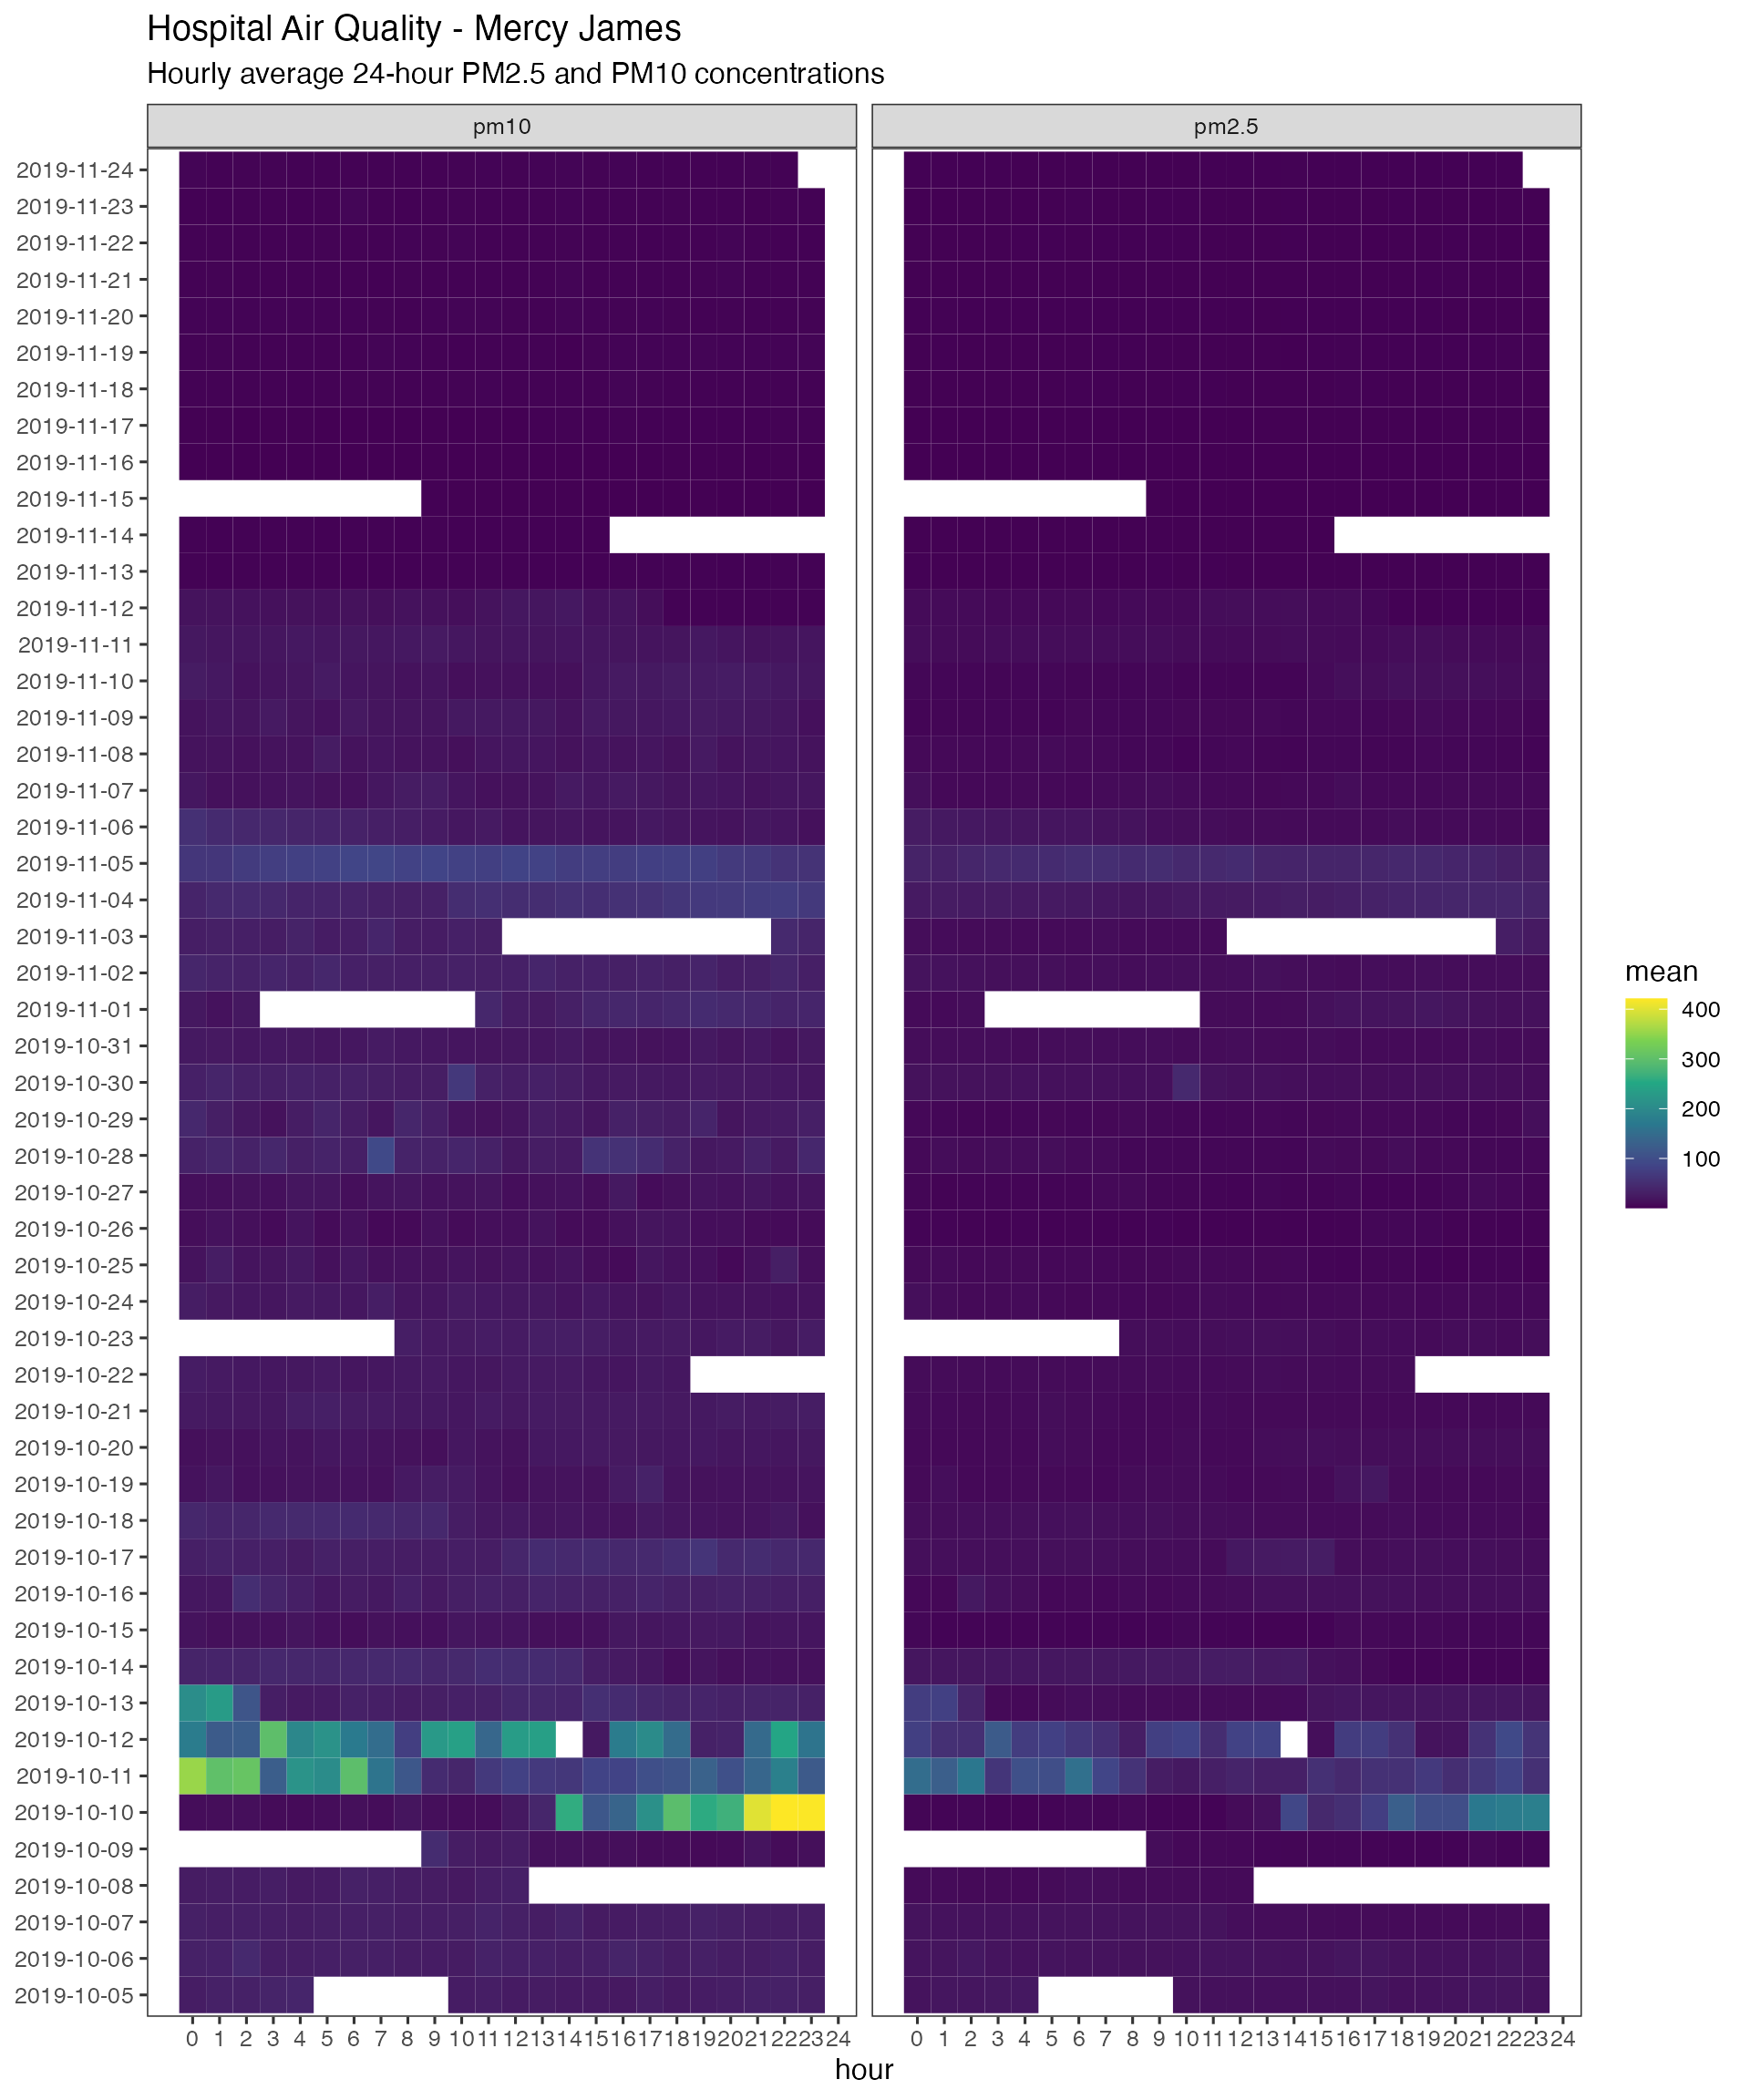
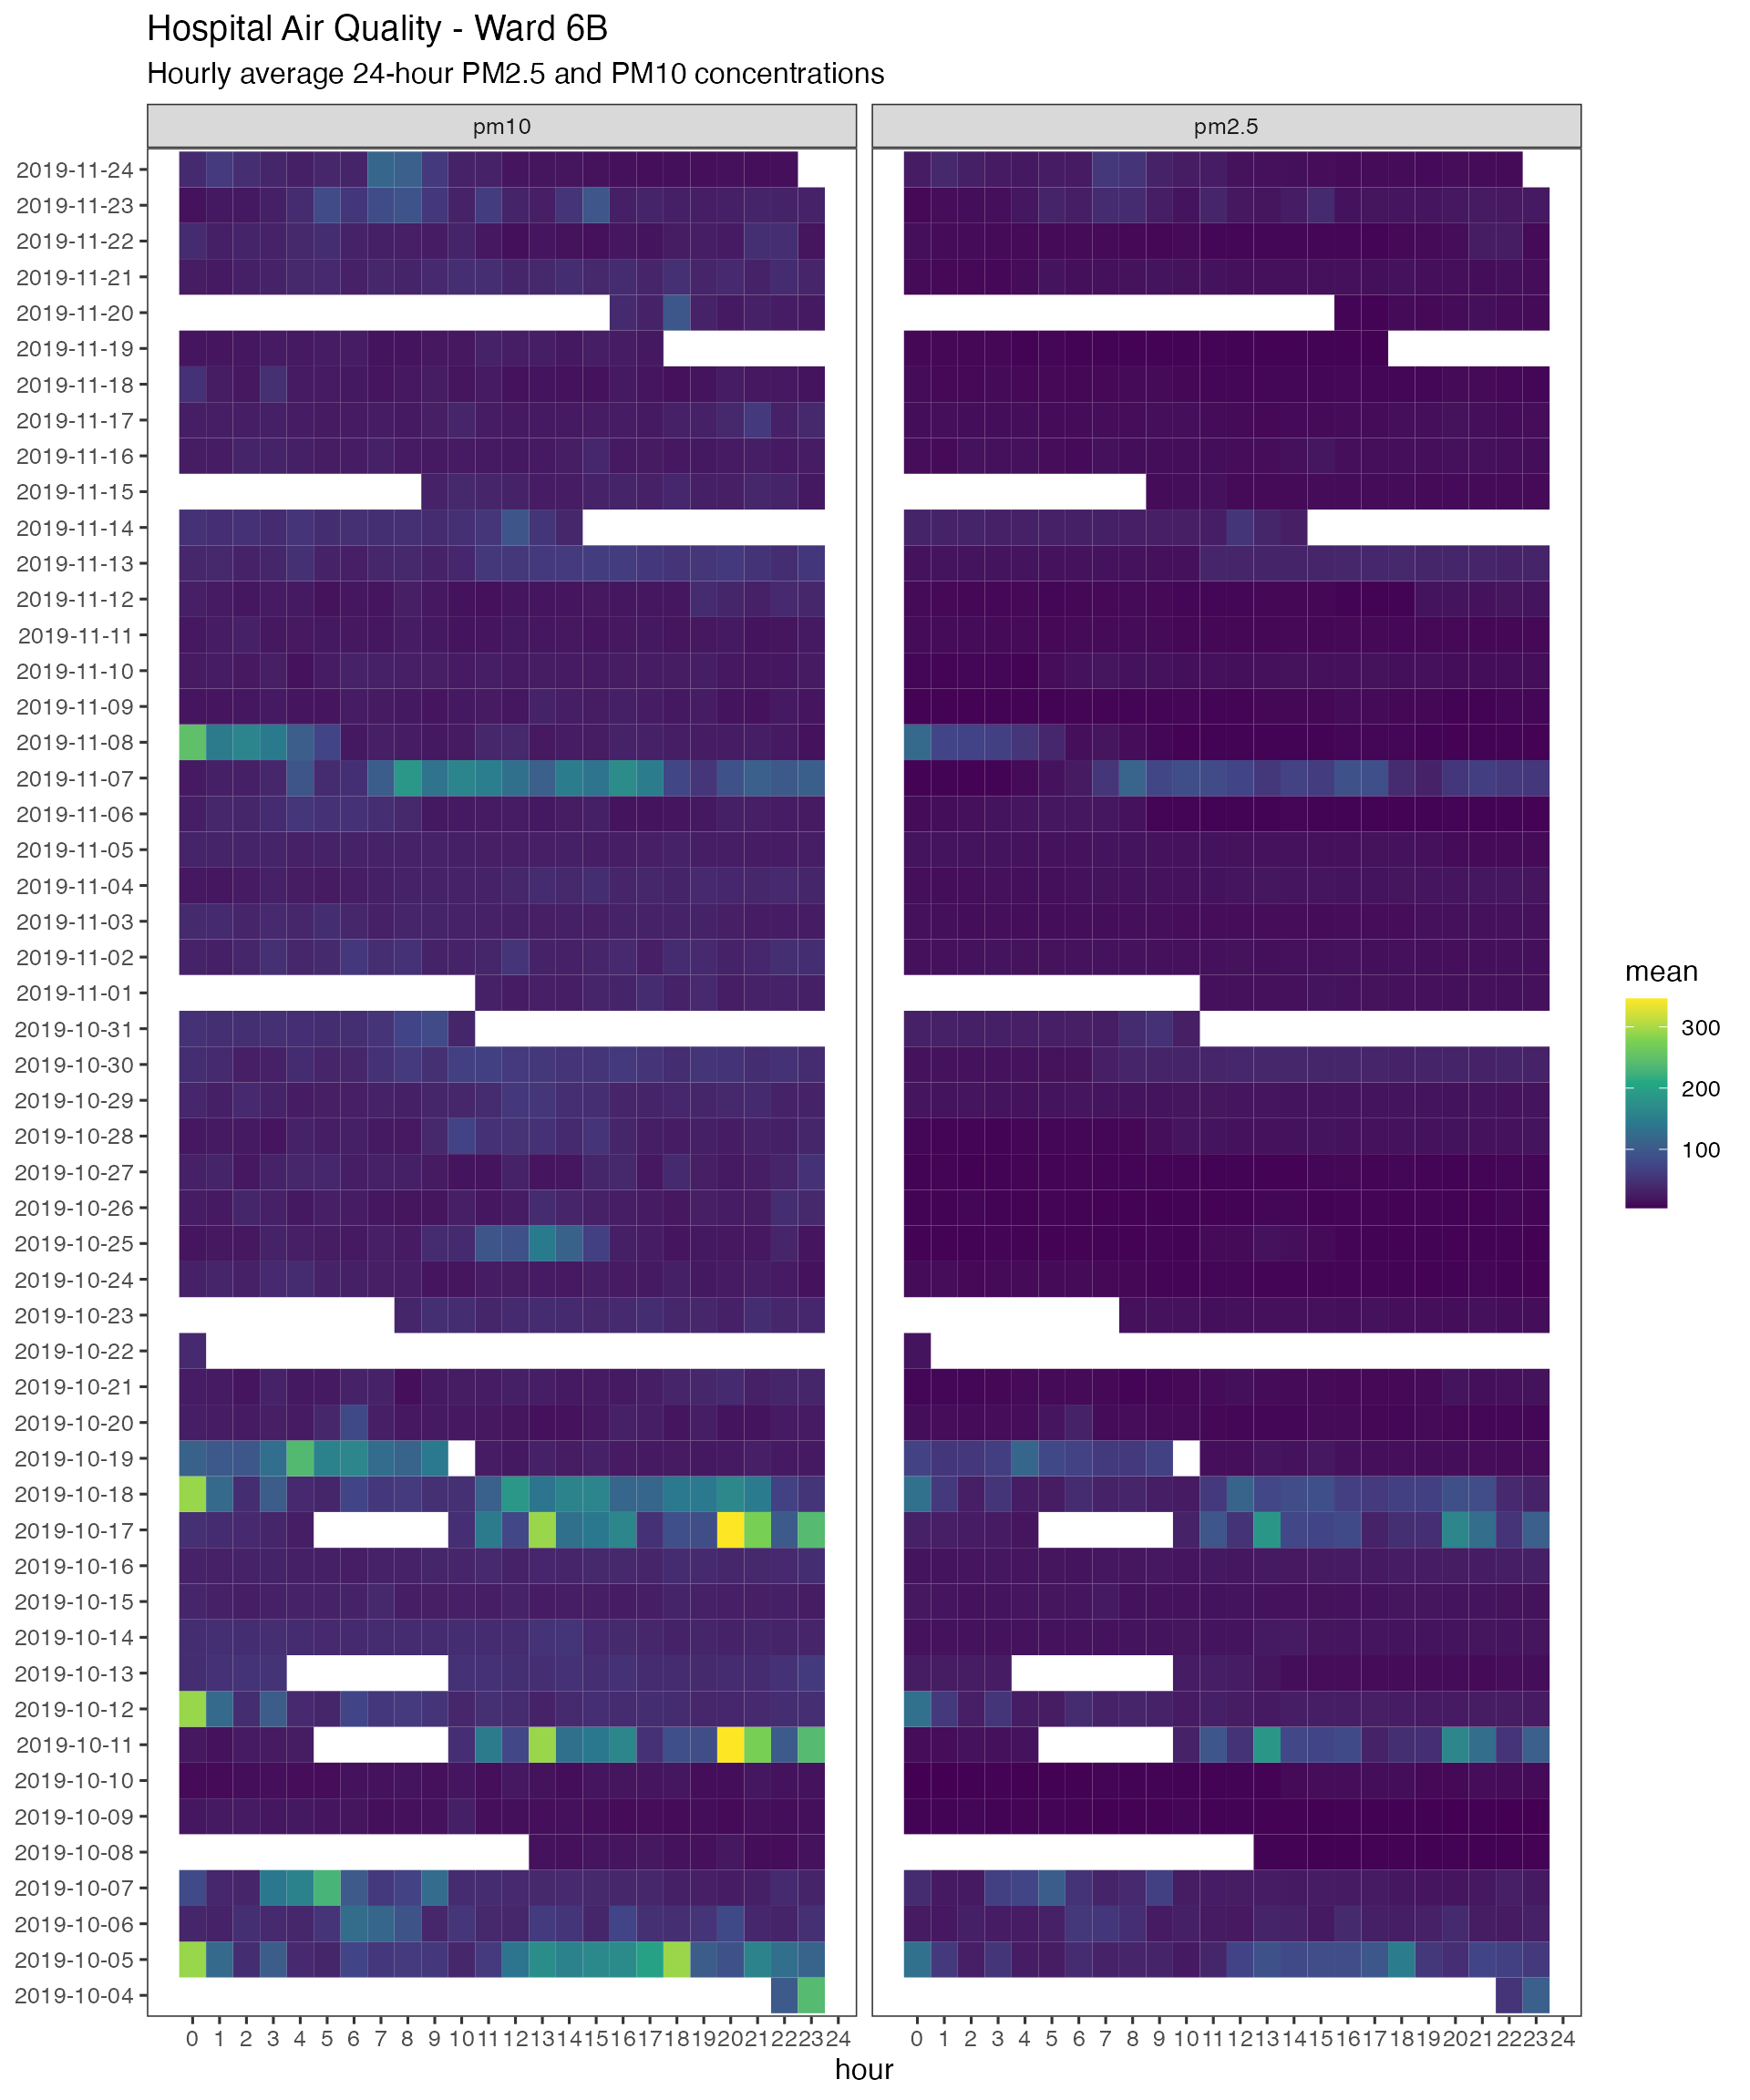
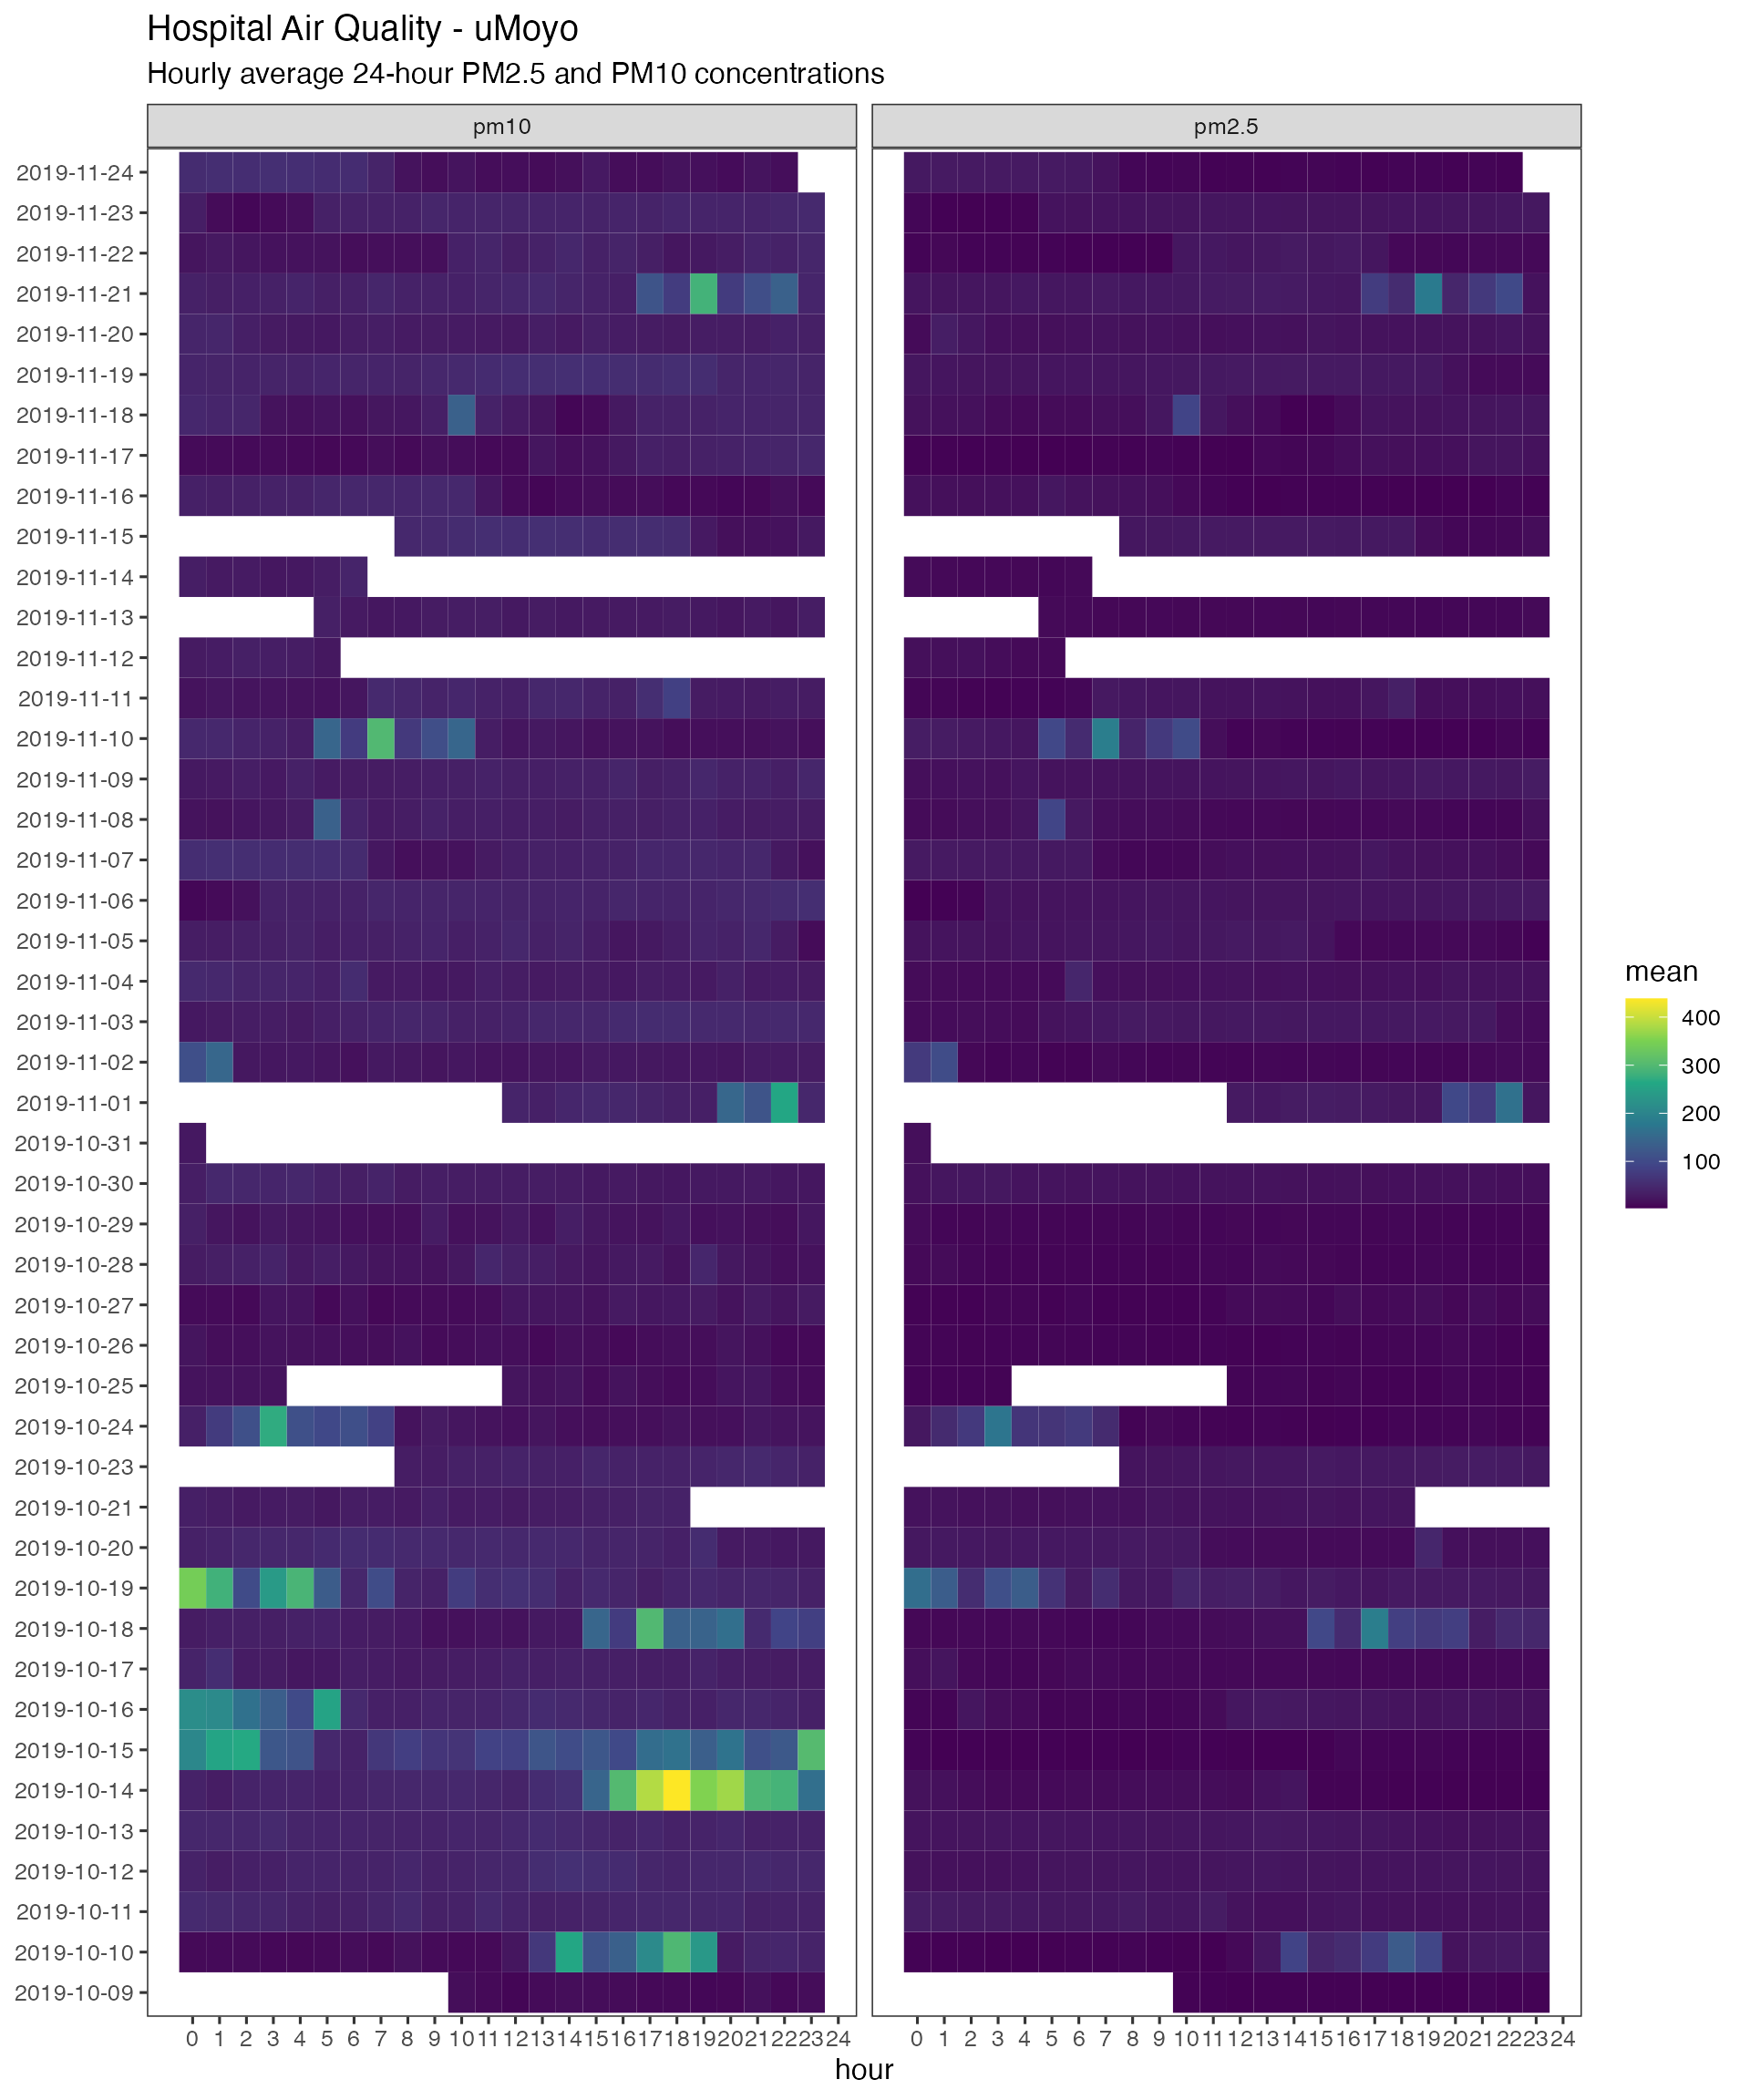
- Hourly average (DONE)
- Exposure in categories of hazard (DONE)
- Peaks over 500 a day (DONE)
- Difference between indoor and outdoor sensors (not started)
- Ratios PM10 / PM25 (differences by location) (WIP)
- Day time vs night time averages (6-18, 18-6) (DONE)
Plot: Daily 24-hour average by date
- Is MJC 0 after 13th November?
- WHO limits are 24-hour averages
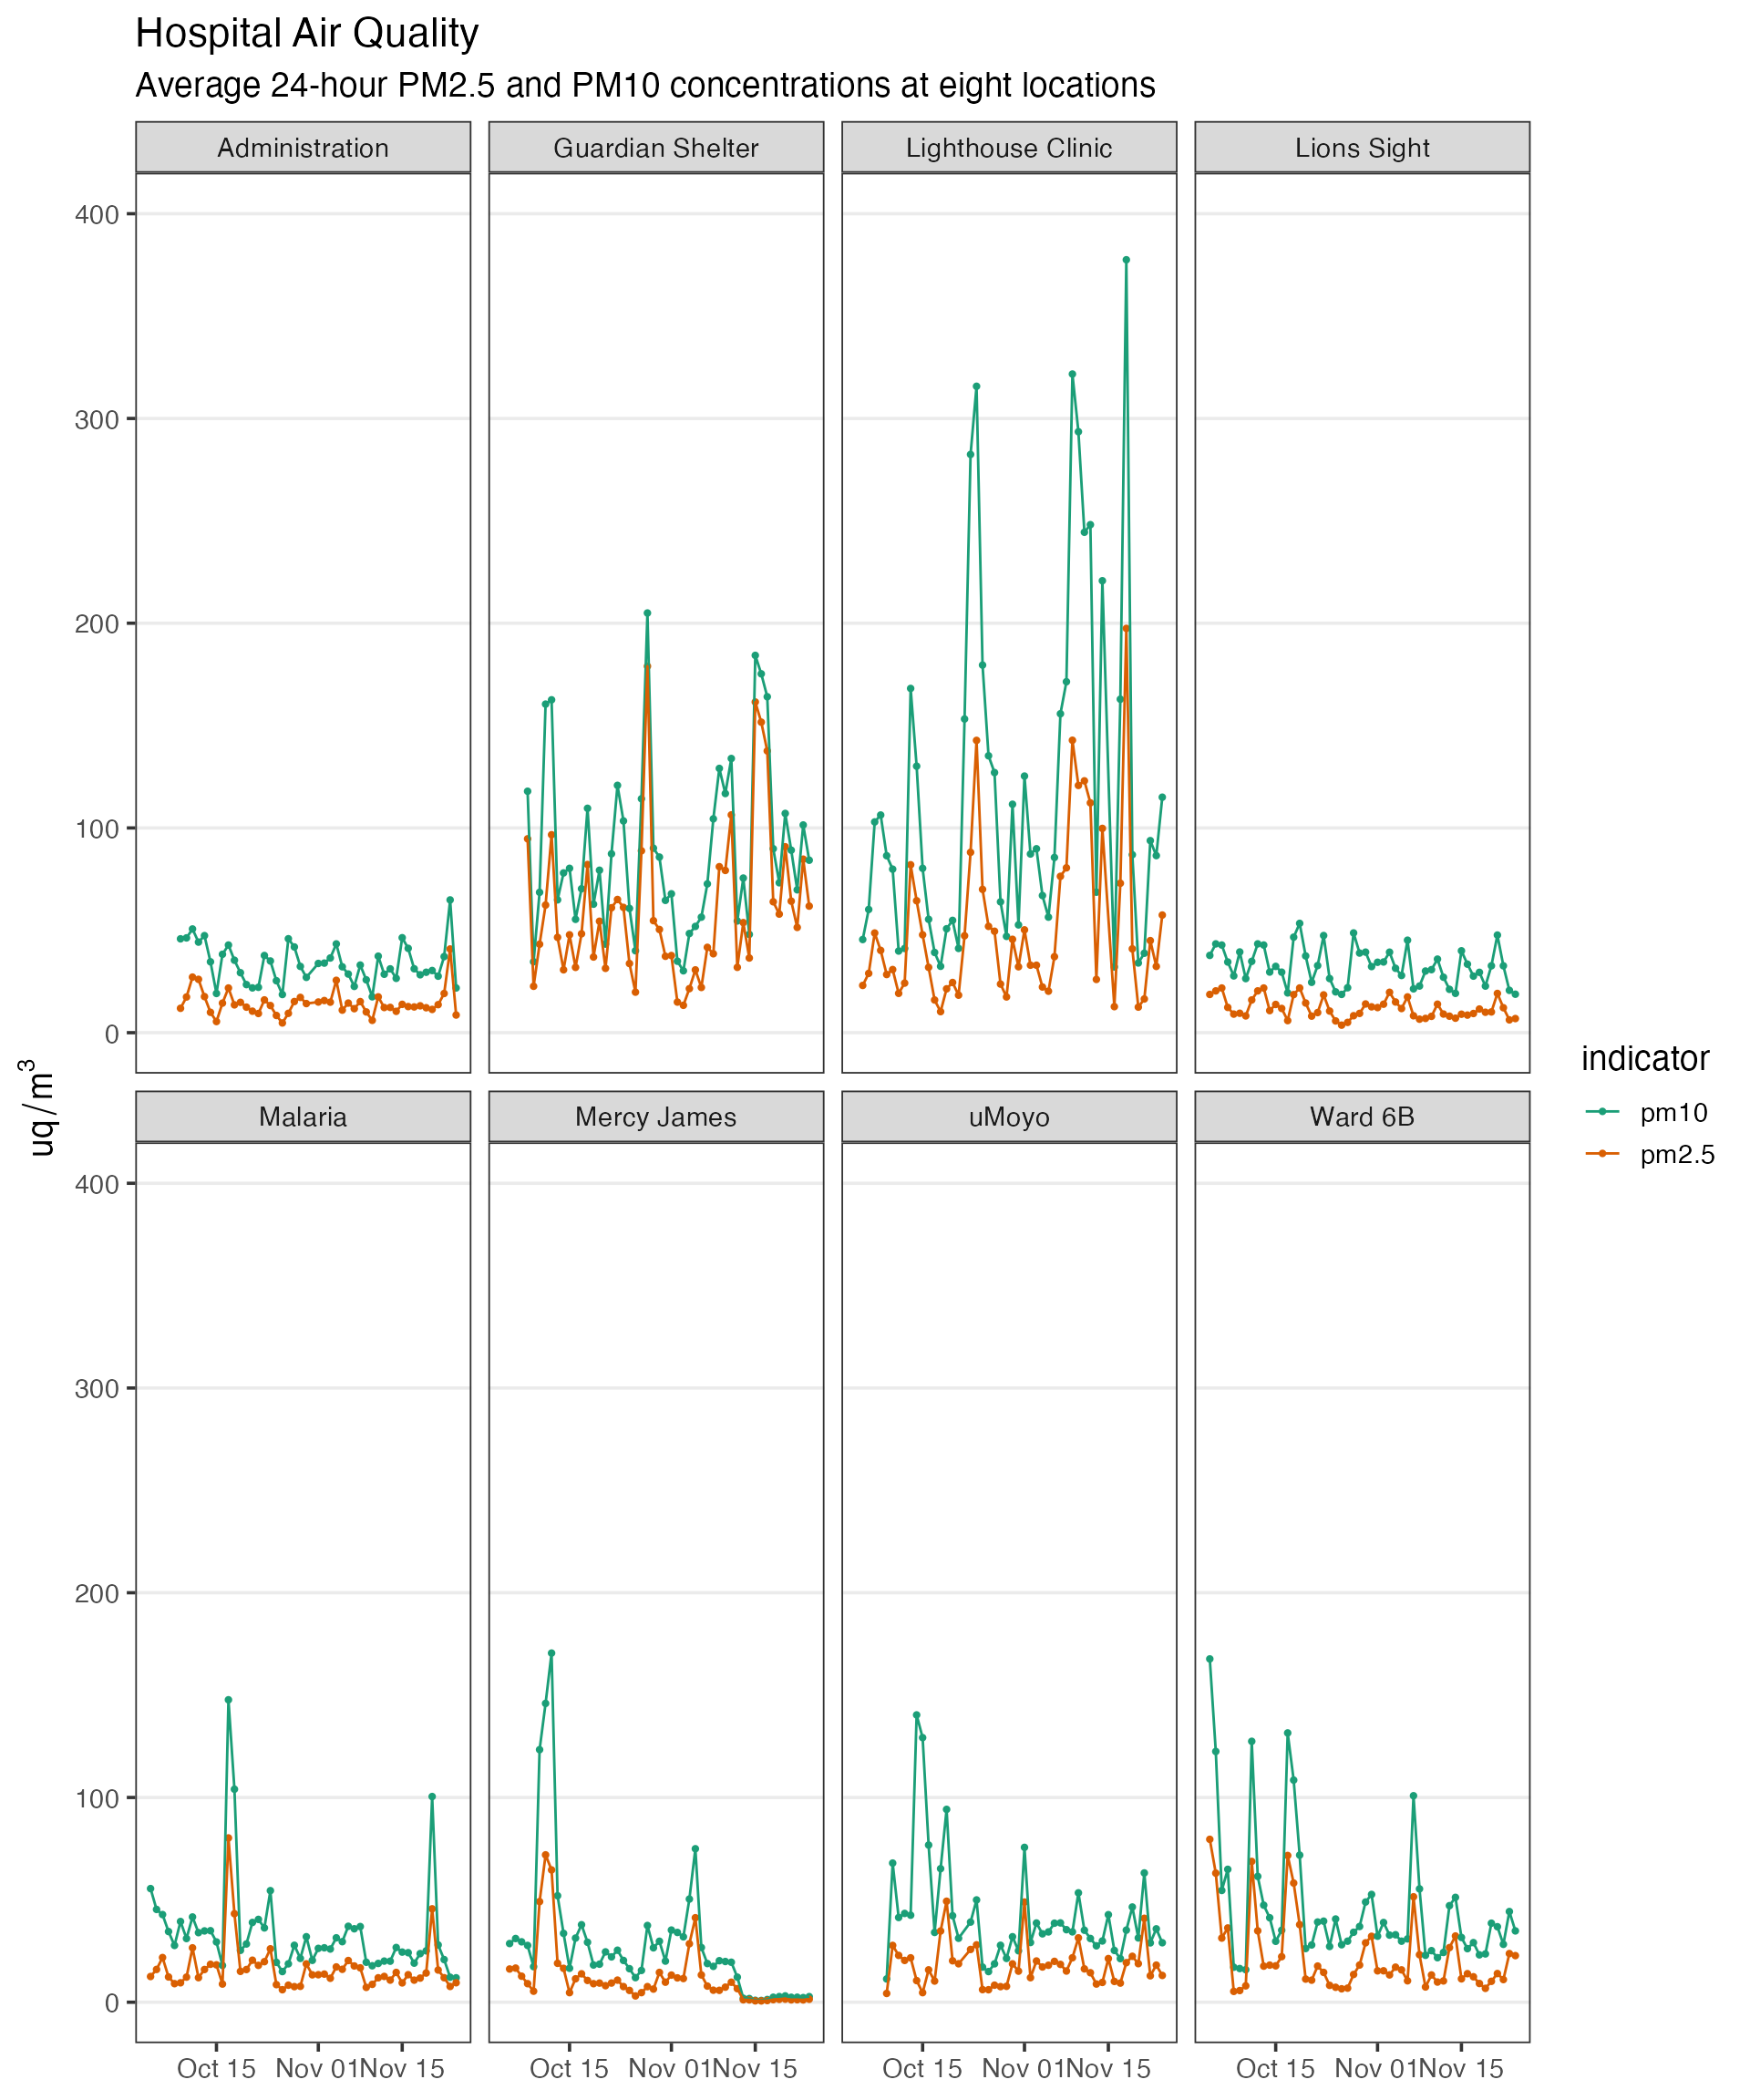
Figure caption me!
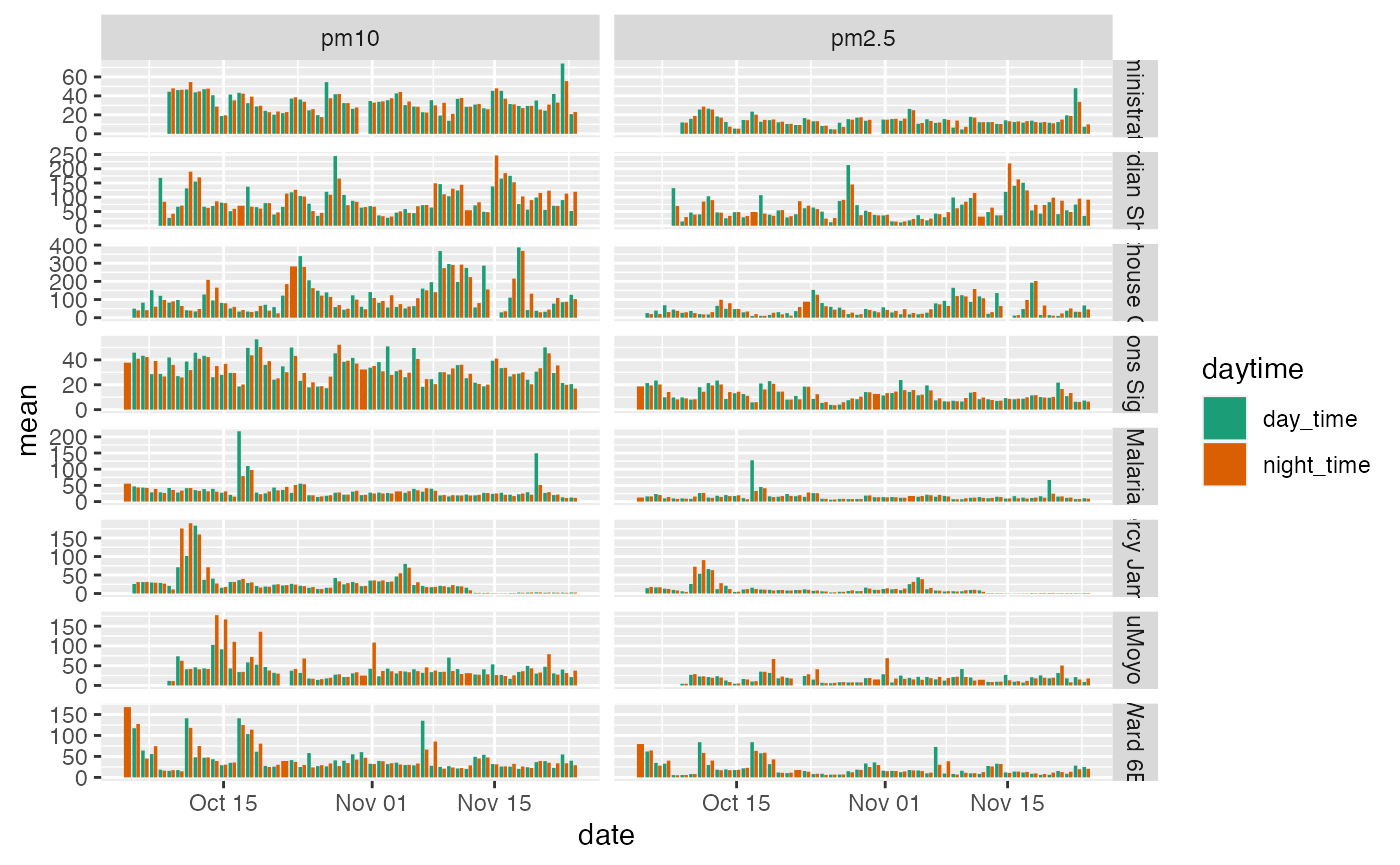

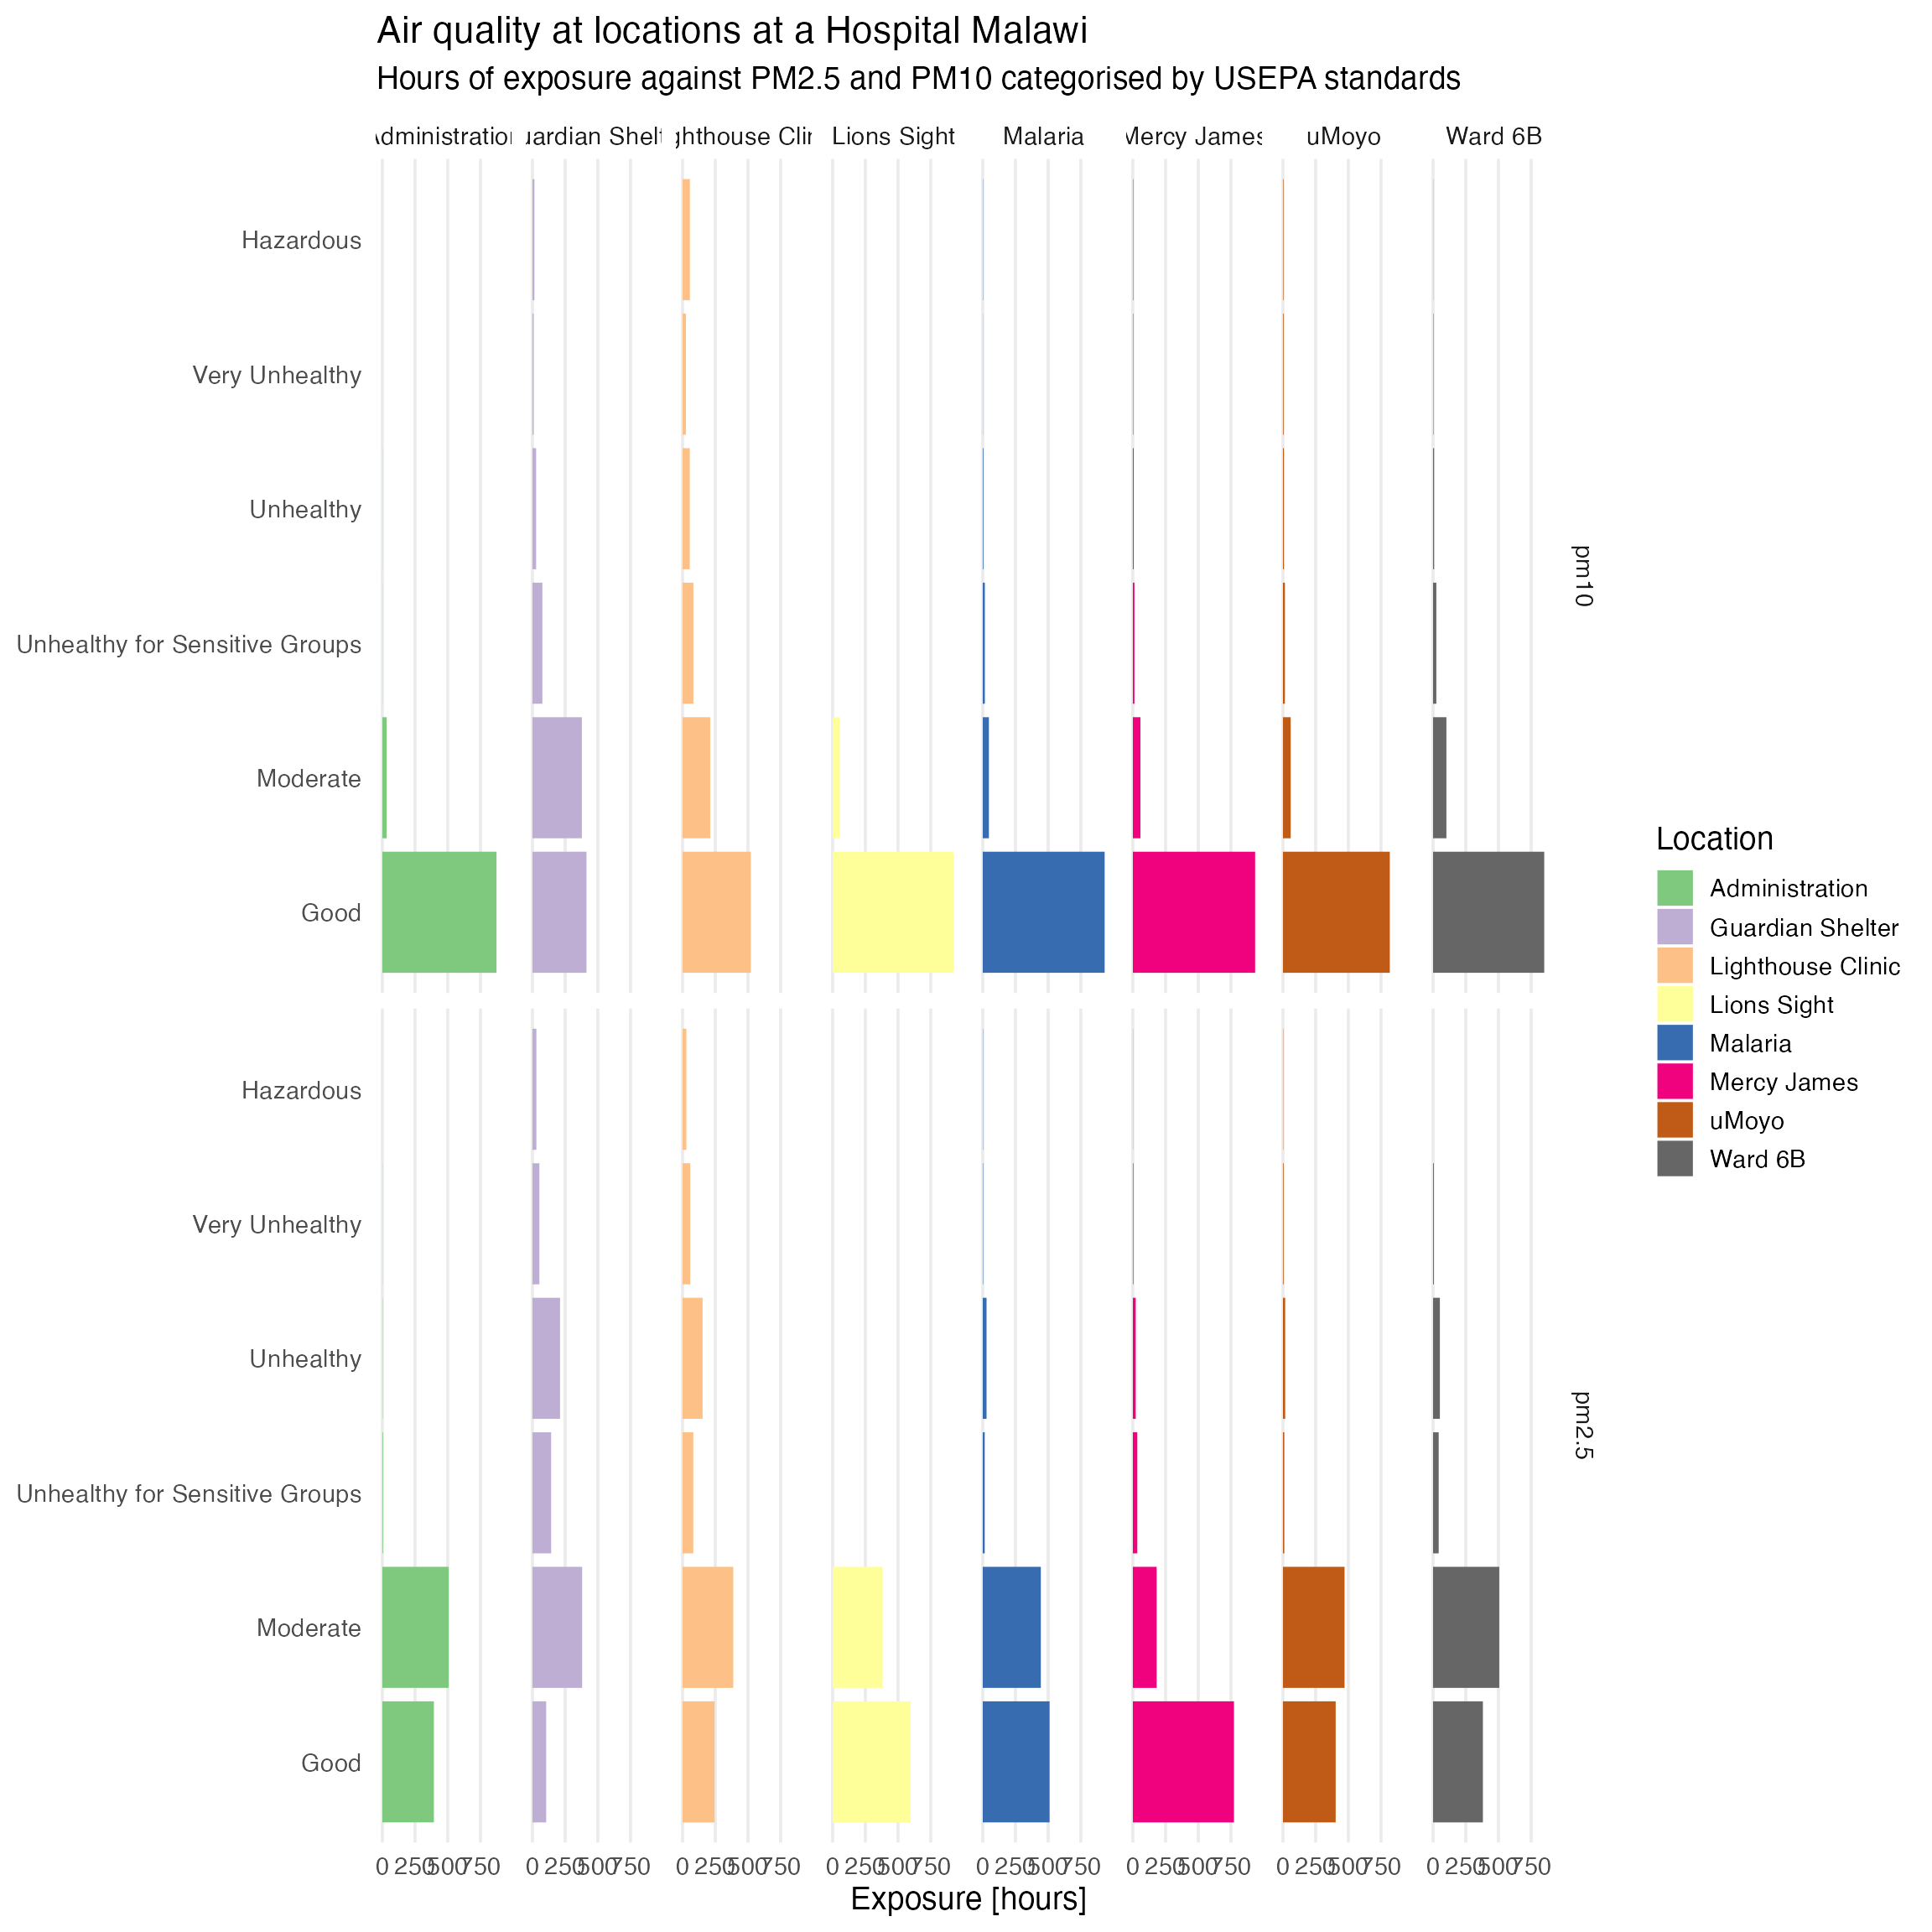
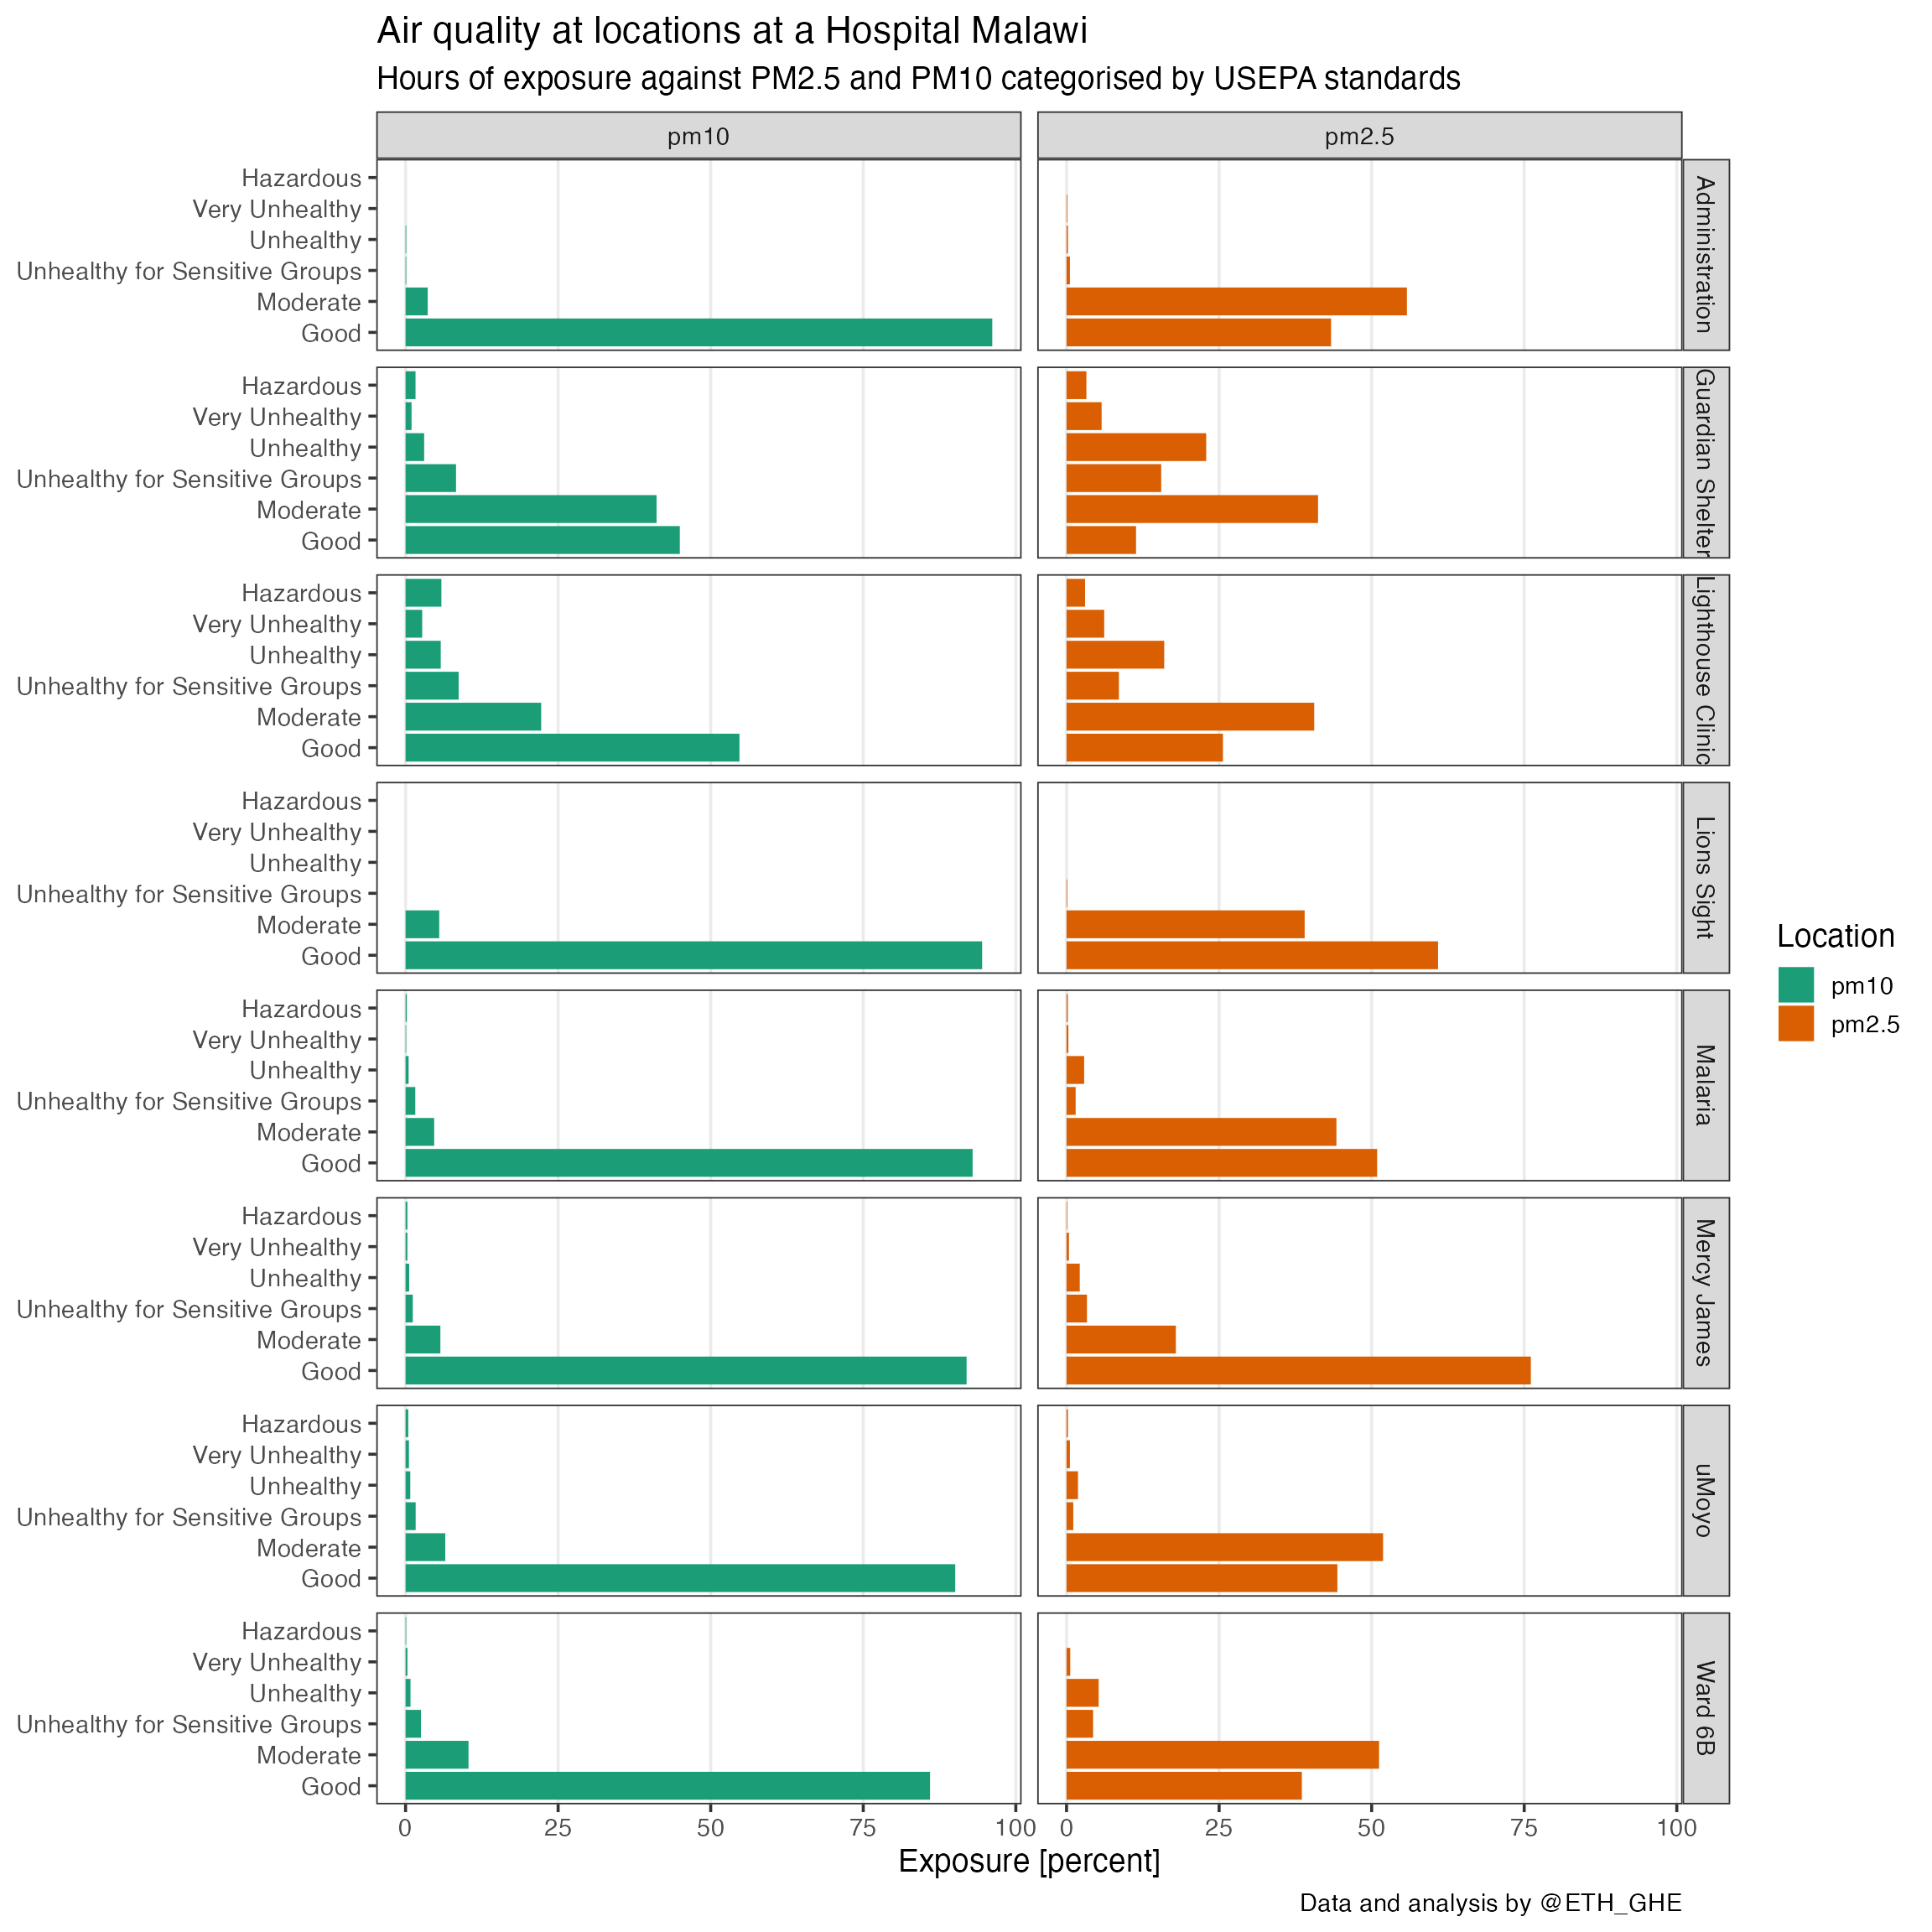
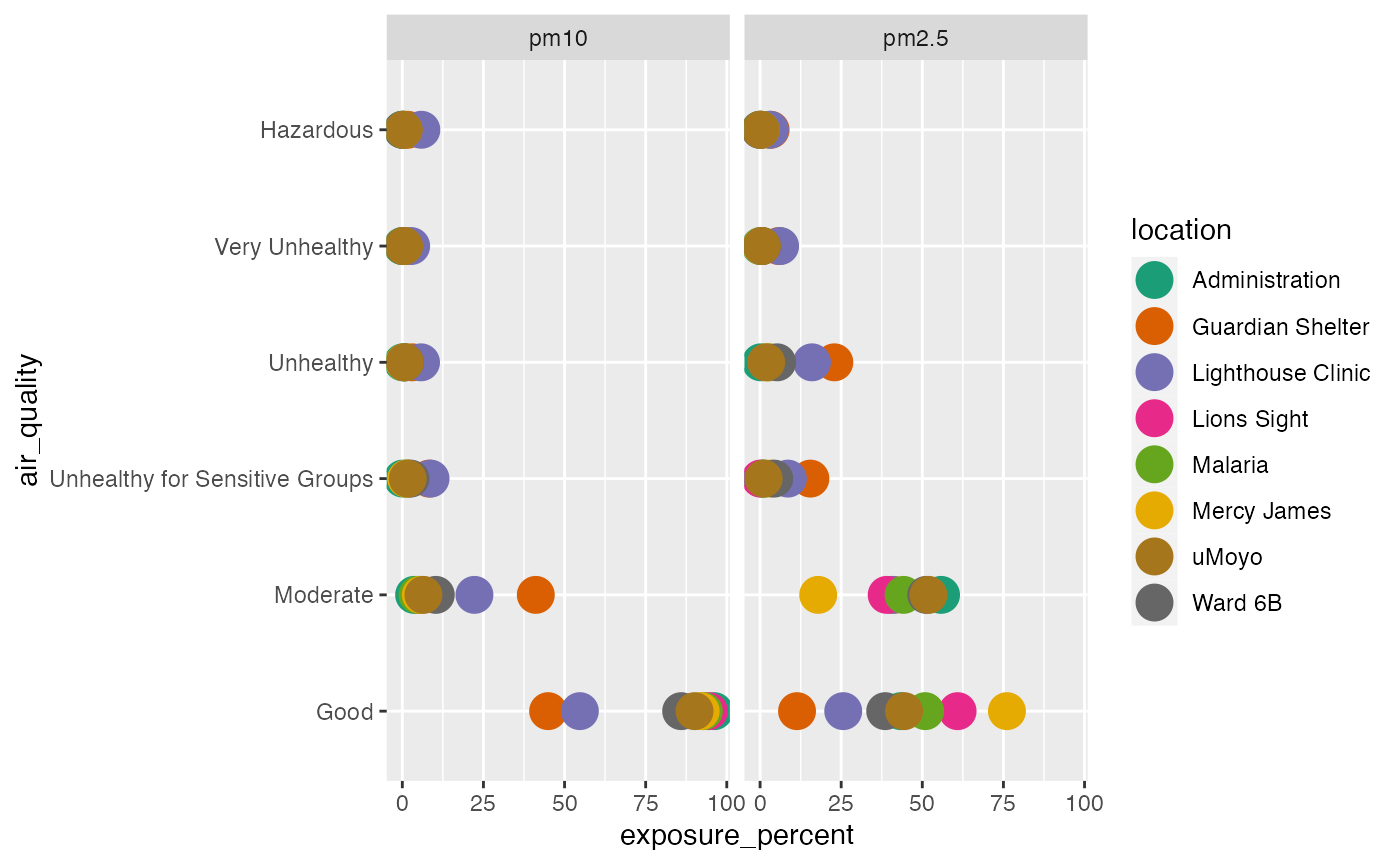
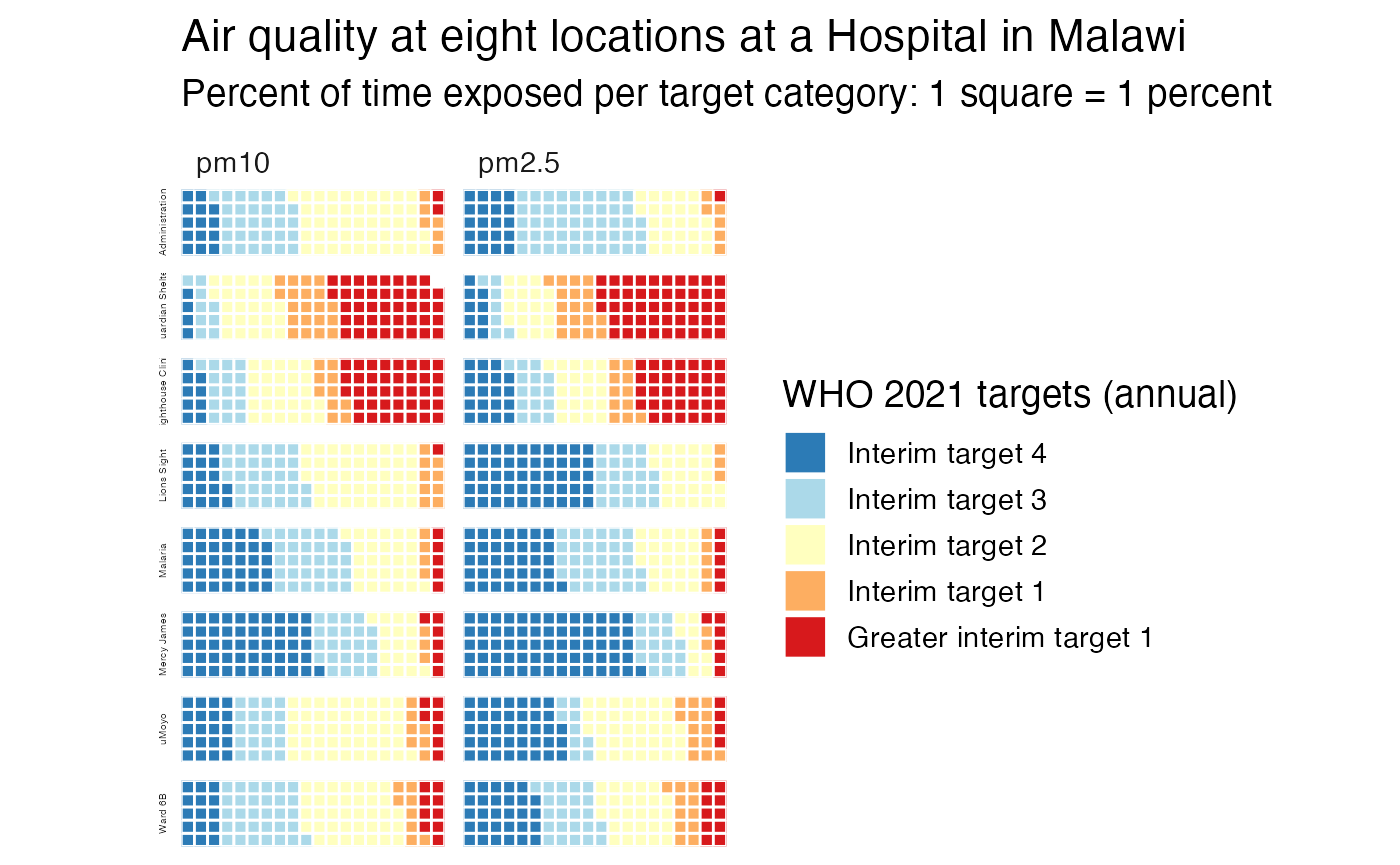
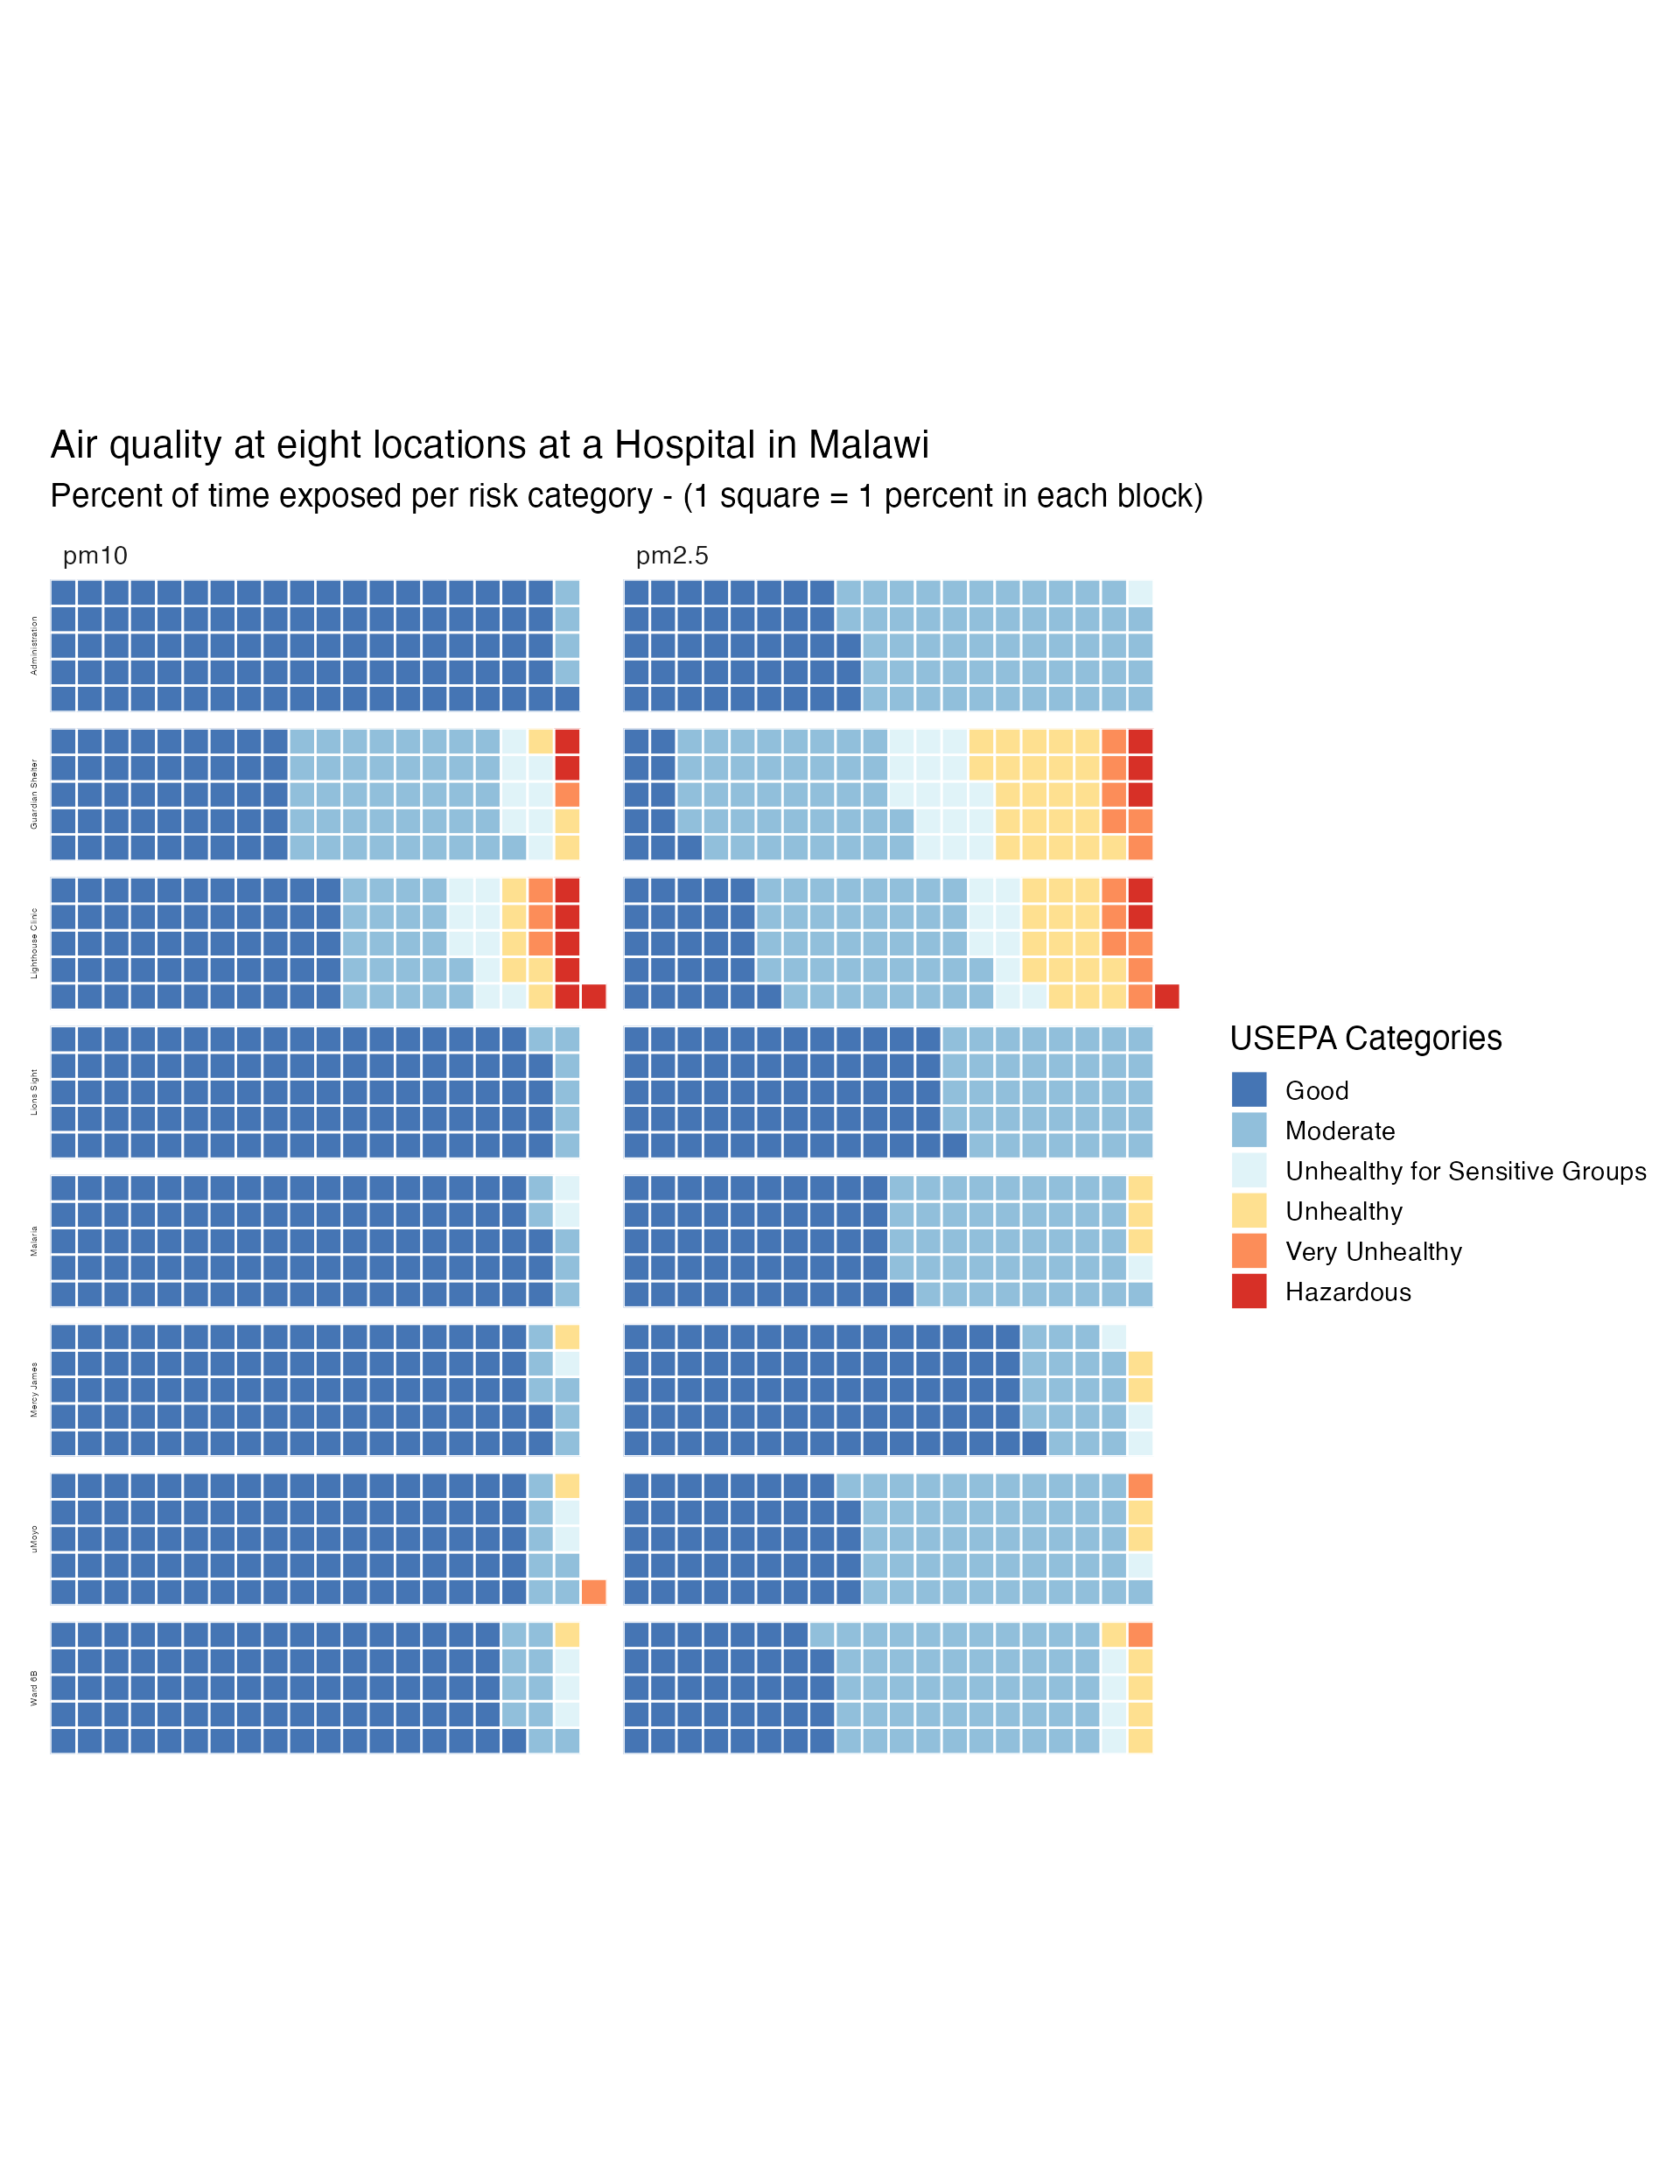
Table: Peaks over the limit for hazardous (US EPA)
- Peak for PM2.5: 250.4
- Peak for PM10: 424.9
- Column peaks counts the number of data points (5 minute intervals between them) above these two limits over all days
| location | n | pm10 | pm2.5 |
|---|---|---|---|
| Administration | 10900 | 1 | 4 |
| Guardian Shelter | 11032 | 178 | 359 |
| Lighthouse Clinic | 11472 | 676 | 350 |
| Lions Sight | 11749 | 0 | 0 |
| Malaria | 12031 | 18 | 19 |
| Mercy James | 12193 | 37 | 15 |
| Ward 6B | 11861 | 15 | 4 |
| uMoyo | 10637 | 43 | 18 |
Table: Peaks over the limit for hazardous ((World Health Organization 2021))
- Peak for PM2.5: > 35 Greater interim target 1, Annual
- Peak for PM10: > 70 Greater interim target 1, Annual
- Column peaks counts the number of data points (5 minute intervals between them) above these two limits over all days
| location | n | pm10 | pm2.5 |
|---|---|---|---|
| Administration | 10900 | 171 | 94 |
| Guardian Shelter | 11032 | 4529 | 5314 |
| Lighthouse Clinic | 11472 | 4365 | 3891 |
| Lions Sight | 11749 | 91 | 14 |
| Malaria | 12031 | 617 | 578 |
| Mercy James | 12193 | 736 | 749 |
| Ward 6B | 11861 | 1113 | 1236 |
| uMoyo | 10637 | 703 | 399 |
Plot: Ratio between PM10 and PM2.5 range from minimum to maximum (WIP)
- Calculation: PM10/PM2.5
- Each line shows the minimum and maximum per day after calculating the average ratio per hour
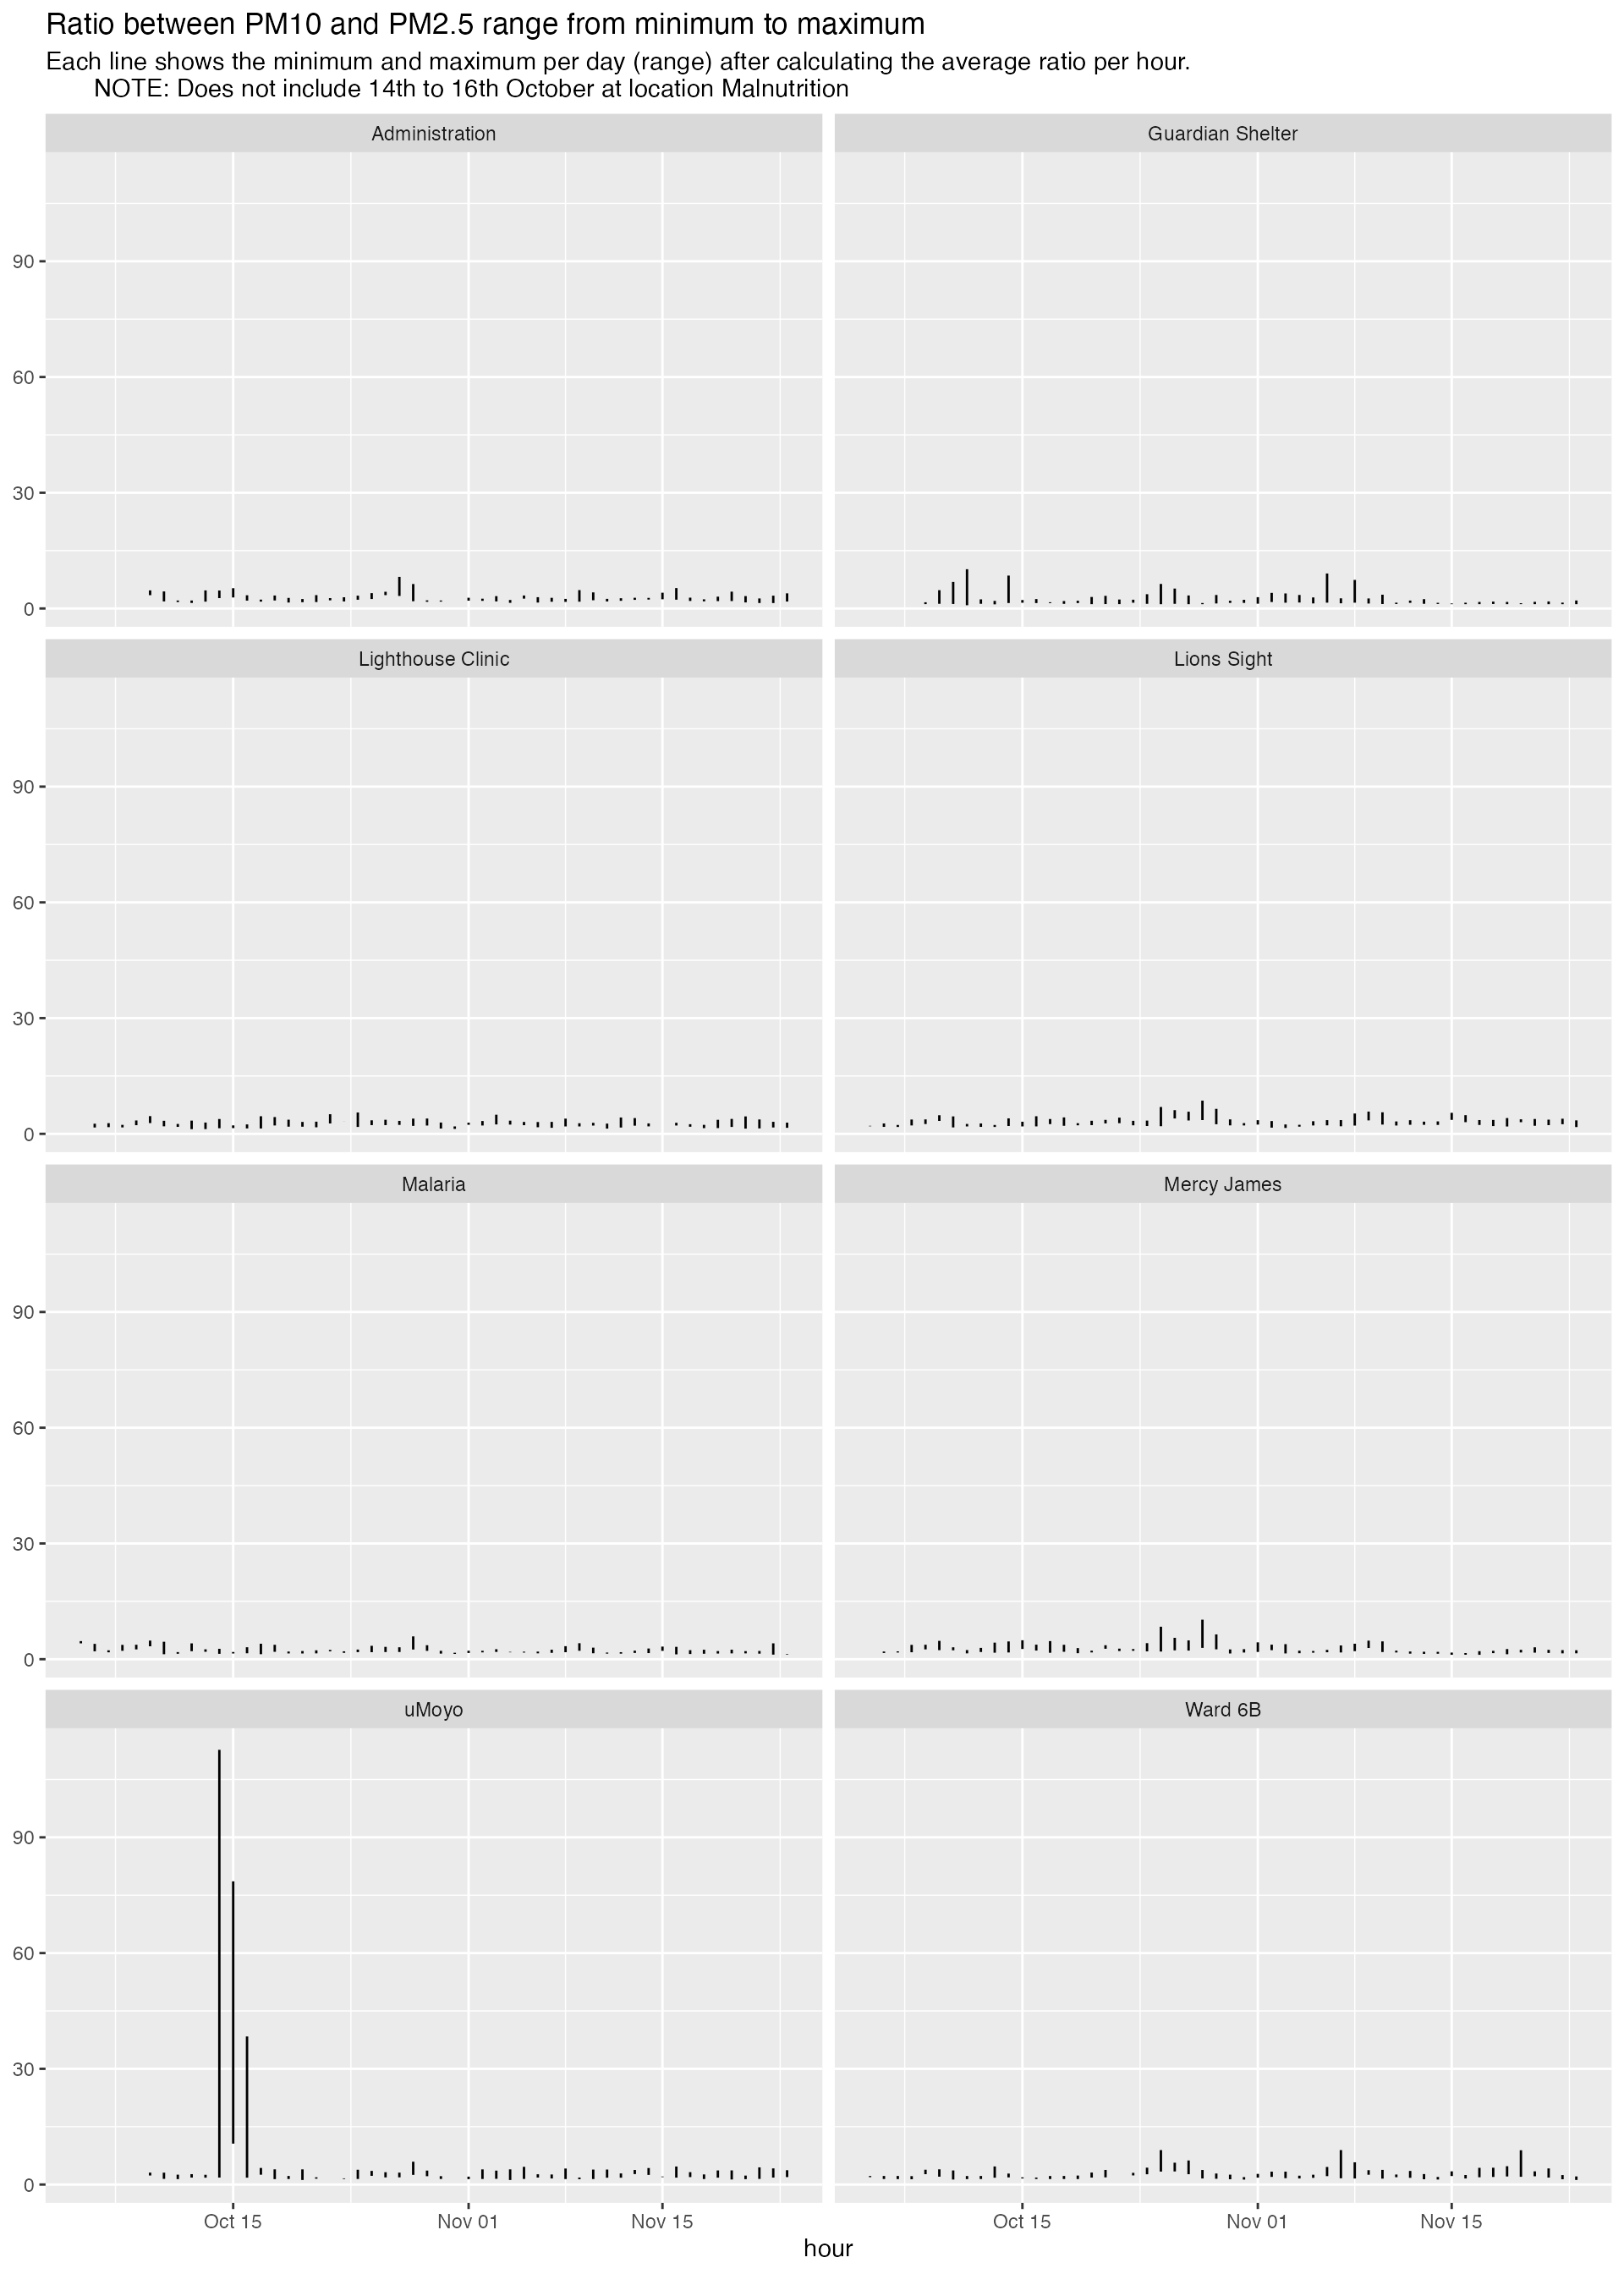
Figure caption me!
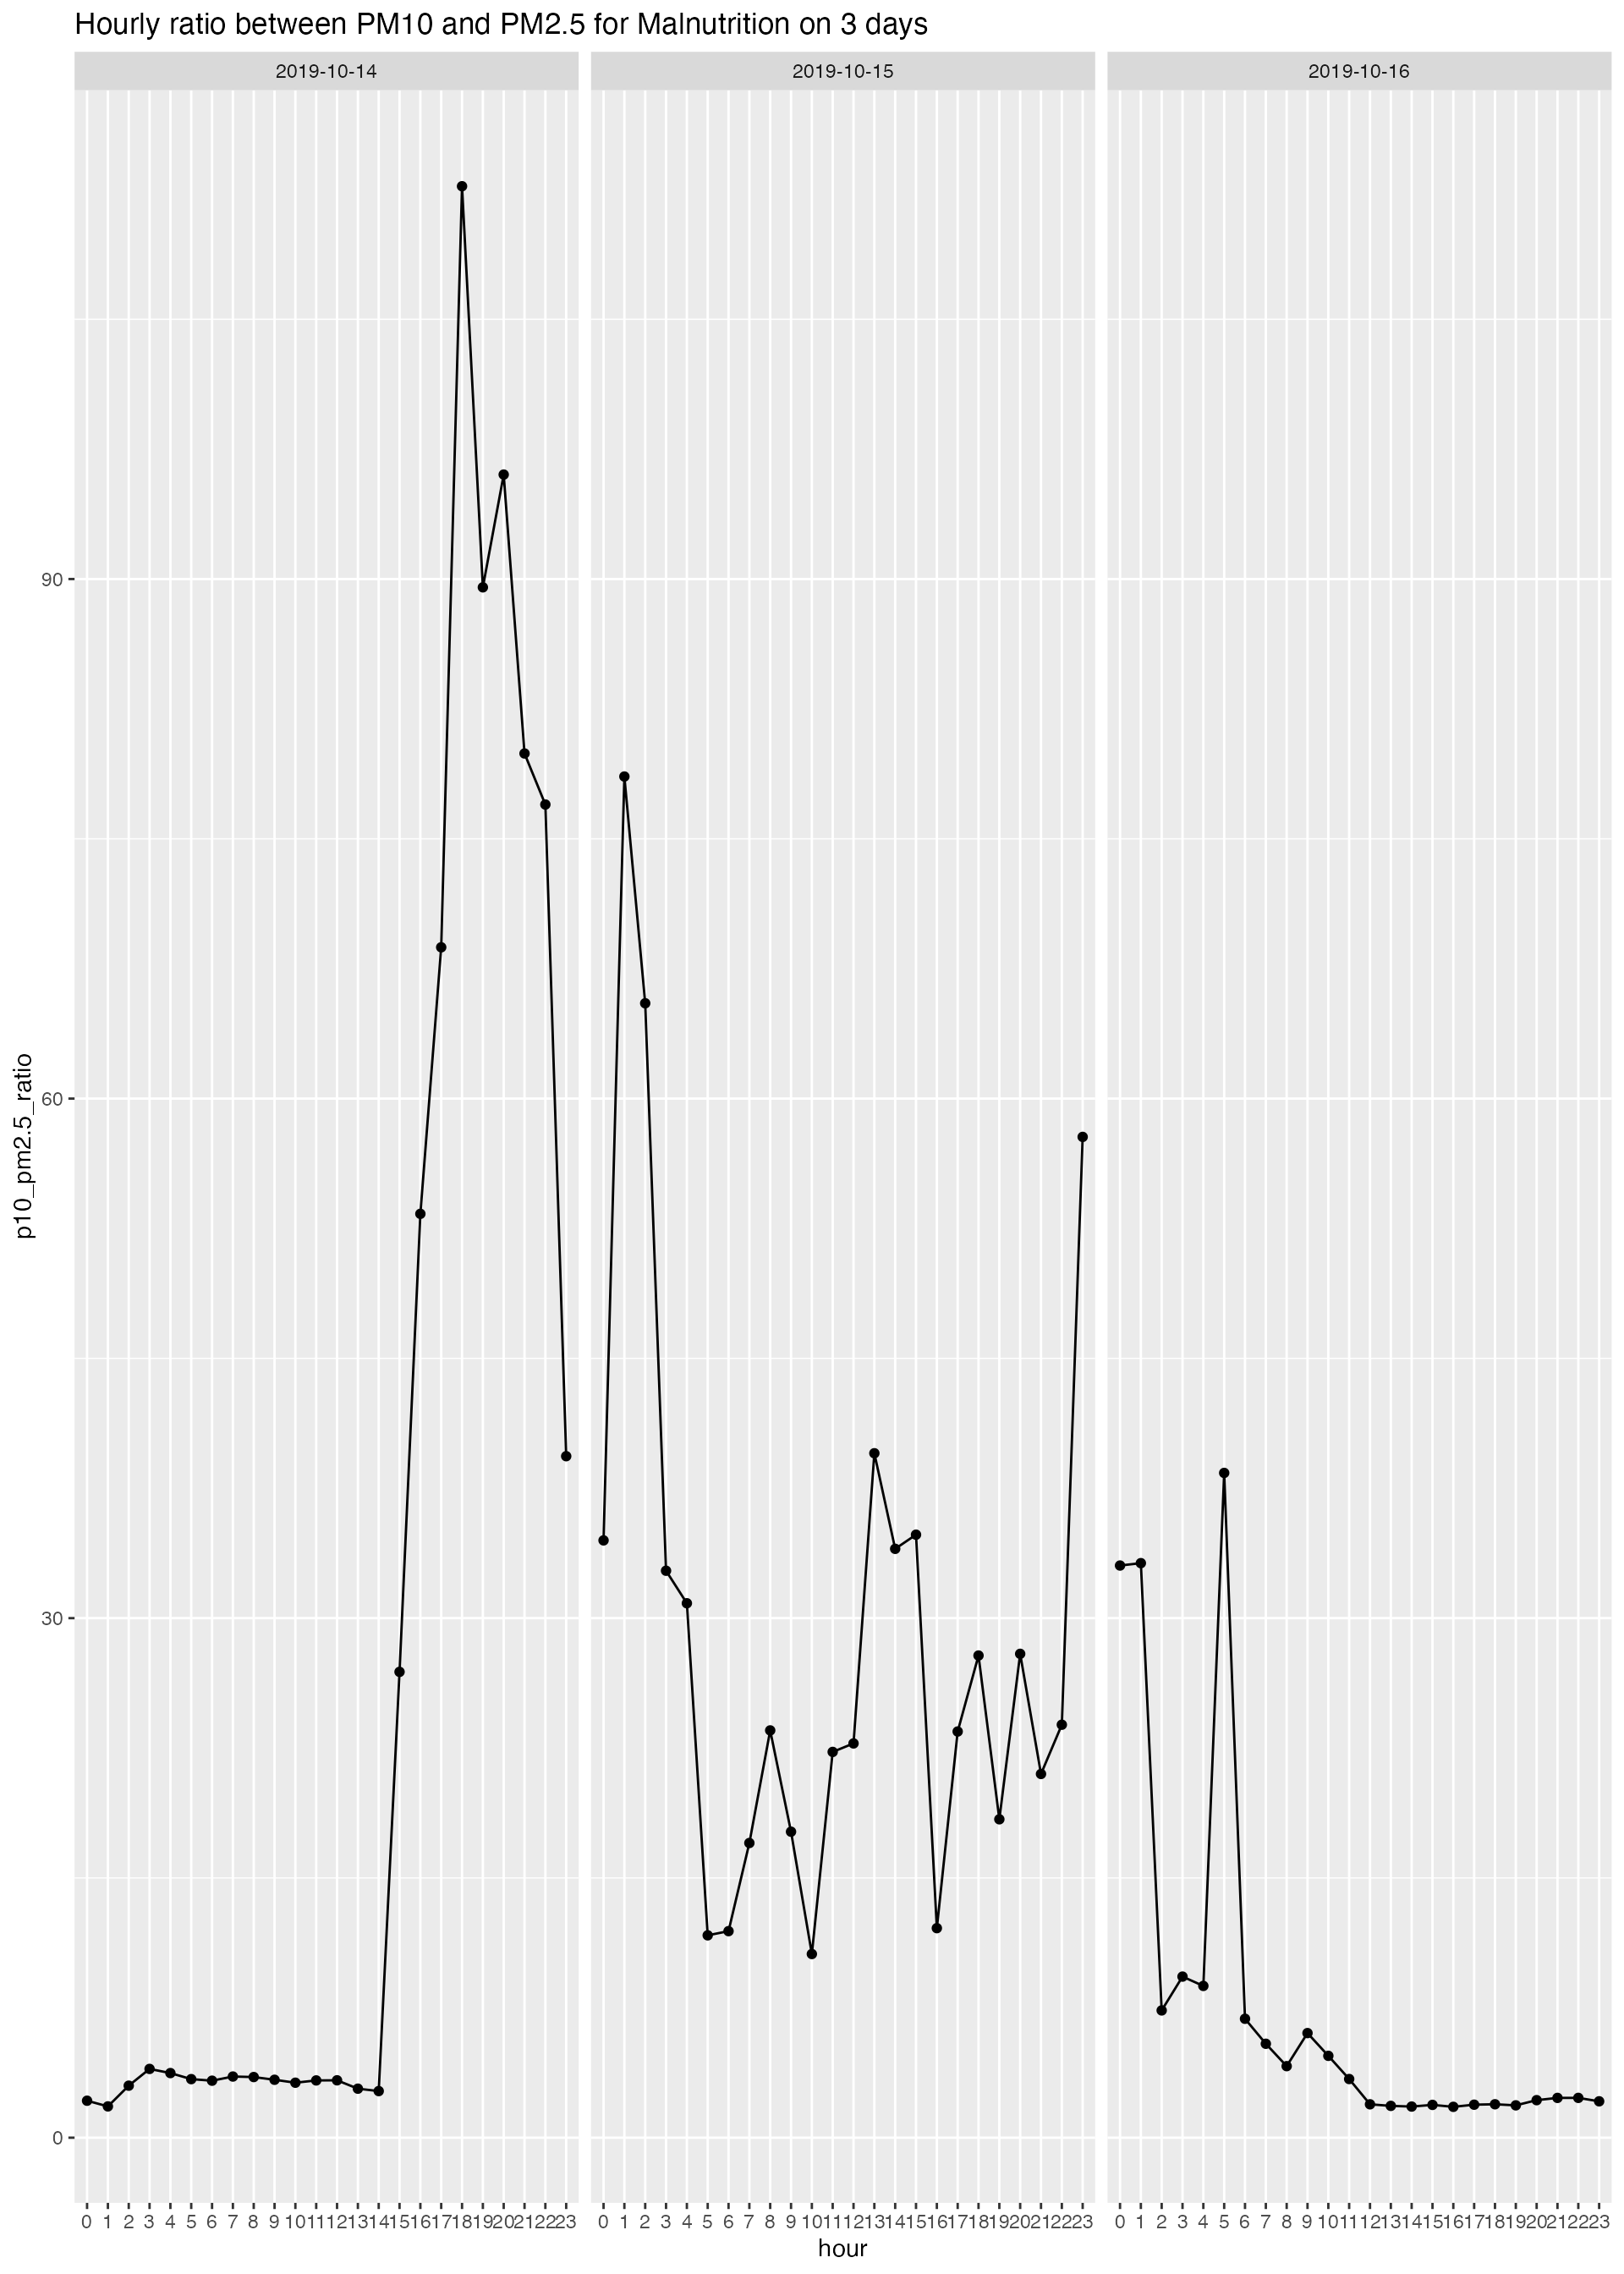
Table: Hourly ratio between PM10 and PM2.5 for Malnutrition on 3 days
- PM10 significantly rises (by tenfold) during these three days
- PM25 descreases at the same time
- The ratio jumps from to 90 from the usual 1 to 5
| date | hour | location | pm10 | pm2.5 | p10_pm2.5_ratio |
|---|---|---|---|---|---|
| 2019-10-14 | 0 | uMoyo | 38 | 18 | 2 |
| 2019-10-14 | 1 | uMoyo | 31 | 17 | 2 |
| 2019-10-14 | 2 | uMoyo | 39 | 13 | 3 |
| 2019-10-14 | 3 | uMoyo | 41 | 10 | 4 |
| 2019-10-14 | 4 | uMoyo | 41 | 11 | 4 |
| 2019-10-14 | 5 | uMoyo | 37 | 11 | 3 |
| 2019-10-14 | 6 | uMoyo | 40 | 12 | 3 |
| 2019-10-14 | 7 | uMoyo | 44 | 12 | 4 |
| 2019-10-14 | 8 | uMoyo | 45 | 13 | 4 |
| 2019-10-14 | 9 | uMoyo | 45 | 14 | 3 |
| 2019-10-14 | 10 | uMoyo | 46 | 14 | 3 |
| 2019-10-14 | 11 | uMoyo | 44 | 13 | 3 |
| 2019-10-14 | 12 | uMoyo | 40 | 12 | 3 |
| 2019-10-14 | 13 | uMoyo | 53 | 19 | 3 |
| 2019-10-14 | 14 | uMoyo | 59 | 22 | 3 |
| 2019-10-14 | 15 | uMoyo | 145 | 5 | 27 |
| 2019-10-14 | 16 | uMoyo | 302 | 6 | 53 |
| 2019-10-14 | 17 | uMoyo | 386 | 6 | 69 |
| 2019-10-14 | 18 | uMoyo | 438 | 4 | 113 |
| 2019-10-14 | 19 | uMoyo | 354 | 4 | 90 |
| 2019-10-14 | 20 | uMoyo | 374 | 4 | 96 |
| 2019-10-14 | 21 | uMoyo | 294 | 4 | 80 |
| 2019-10-14 | 22 | uMoyo | 287 | 4 | 77 |
| 2019-10-14 | 23 | uMoyo | 162 | 4 | 39 |
| 2019-10-15 | 0 | uMoyo | 204 | 6 | 34 |
| 2019-10-15 | 1 | uMoyo | 258 | 3 | 79 |
| 2019-10-15 | 2 | uMoyo | 266 | 4 | 66 |
| 2019-10-15 | 3 | uMoyo | 121 | 4 | 33 |
| 2019-10-15 | 4 | uMoyo | 114 | 4 | 31 |
| 2019-10-15 | 5 | uMoyo | 47 | 4 | 12 |
| 2019-10-15 | 6 | uMoyo | 39 | 3 | 12 |
| 2019-10-15 | 7 | uMoyo | 69 | 4 | 17 |
| 2019-10-15 | 8 | uMoyo | 81 | 3 | 24 |
| 2019-10-15 | 9 | uMoyo | 66 | 4 | 18 |
| 2019-10-15 | 10 | uMoyo | 64 | 6 | 11 |
| 2019-10-15 | 11 | uMoyo | 87 | 4 | 22 |
| 2019-10-15 | 12 | uMoyo | 85 | 4 | 23 |
| 2019-10-15 | 13 | uMoyo | 119 | 3 | 40 |
| 2019-10-15 | 14 | uMoyo | 102 | 3 | 34 |
| 2019-10-15 | 15 | uMoyo | 121 | 3 | 35 |
| 2019-10-15 | 16 | uMoyo | 99 | 8 | 12 |
| 2019-10-15 | 17 | uMoyo | 159 | 7 | 23 |
| 2019-10-15 | 18 | uMoyo | 167 | 6 | 28 |
| 2019-10-15 | 19 | uMoyo | 134 | 7 | 18 |
| 2019-10-15 | 20 | uMoyo | 168 | 6 | 28 |
| 2019-10-15 | 21 | uMoyo | 109 | 5 | 21 |
| 2019-10-15 | 22 | uMoyo | 124 | 5 | 24 |
| 2019-10-15 | 23 | uMoyo | 304 | 5 | 58 |
| 2019-10-16 | 0 | uMoyo | 215 | 7 | 33 |
| 2019-10-16 | 1 | uMoyo | 210 | 6 | 33 |
| 2019-10-16 | 2 | uMoyo | 165 | 22 | 7 |
| 2019-10-16 | 3 | uMoyo | 134 | 14 | 9 |
| 2019-10-16 | 4 | uMoyo | 99 | 11 | 9 |
| 2019-10-16 | 5 | uMoyo | 255 | 7 | 38 |
| 2019-10-16 | 6 | uMoyo | 48 | 7 | 7 |
| 2019-10-16 | 7 | uMoyo | 36 | 7 | 5 |
| 2019-10-16 | 8 | uMoyo | 36 | 9 | 4 |
| 2019-10-16 | 9 | uMoyo | 41 | 7 | 6 |
| 2019-10-16 | 10 | uMoyo | 40 | 9 | 5 |
| 2019-10-16 | 11 | uMoyo | 41 | 12 | 3 |
| 2019-10-16 | 12 | uMoyo | 47 | 24 | 2 |
| 2019-10-16 | 13 | uMoyo | 51 | 28 | 2 |
| 2019-10-16 | 14 | uMoyo | 48 | 27 | 2 |
| 2019-10-16 | 15 | uMoyo | 45 | 24 | 2 |
| 2019-10-16 | 16 | uMoyo | 39 | 22 | 2 |
| 2019-10-16 | 17 | uMoyo | 44 | 23 | 2 |
| 2019-10-16 | 18 | uMoyo | 38 | 20 | 2 |
| 2019-10-16 | 19 | uMoyo | 36 | 19 | 2 |
| 2019-10-16 | 20 | uMoyo | 45 | 21 | 2 |
| 2019-10-16 | 21 | uMoyo | 46 | 20 | 2 |
| 2019-10-16 | 22 | uMoyo | 41 | 18 | 2 |
| 2019-10-16 | 23 | uMoyo | 36 | 17 | 2 |